
Figure 1.
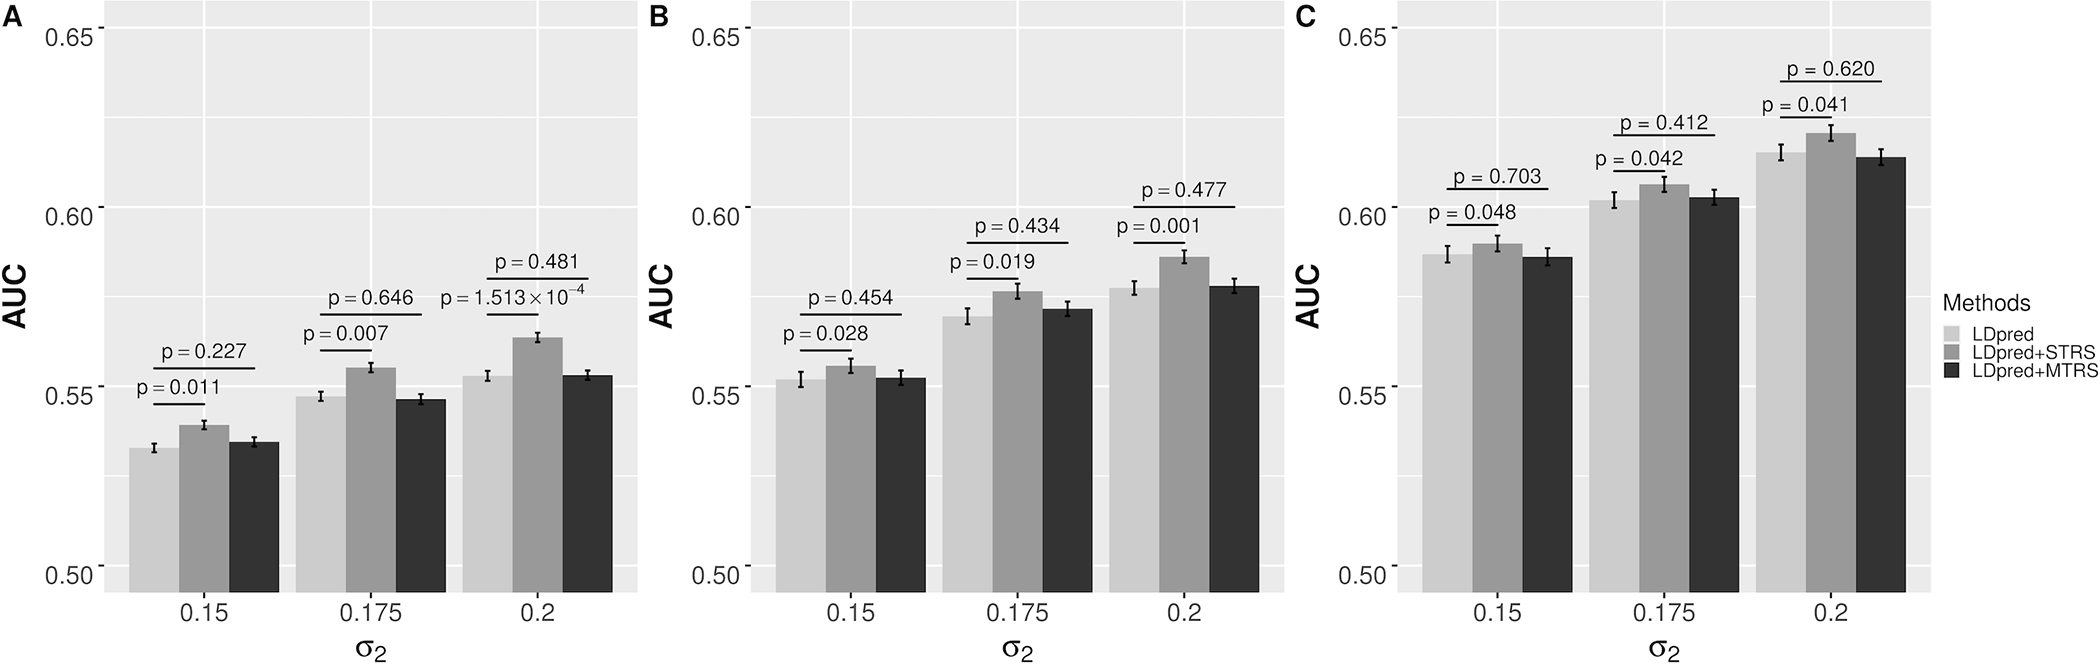
AUCs of different risk prediction methods in simulation scenario I that all causal genes are from a single tissue: (a) σ1 = 0.08; (b) σ1 = 0.10; (c) σ1 = 0.12. The error bars indicate the standard error of prediction accuracy across 100 stratified bootstrap replicates. p-value is based on the bootstrap test of comparing LDpred with STRS or MTRS across 100 stratified bootstrap replicates.