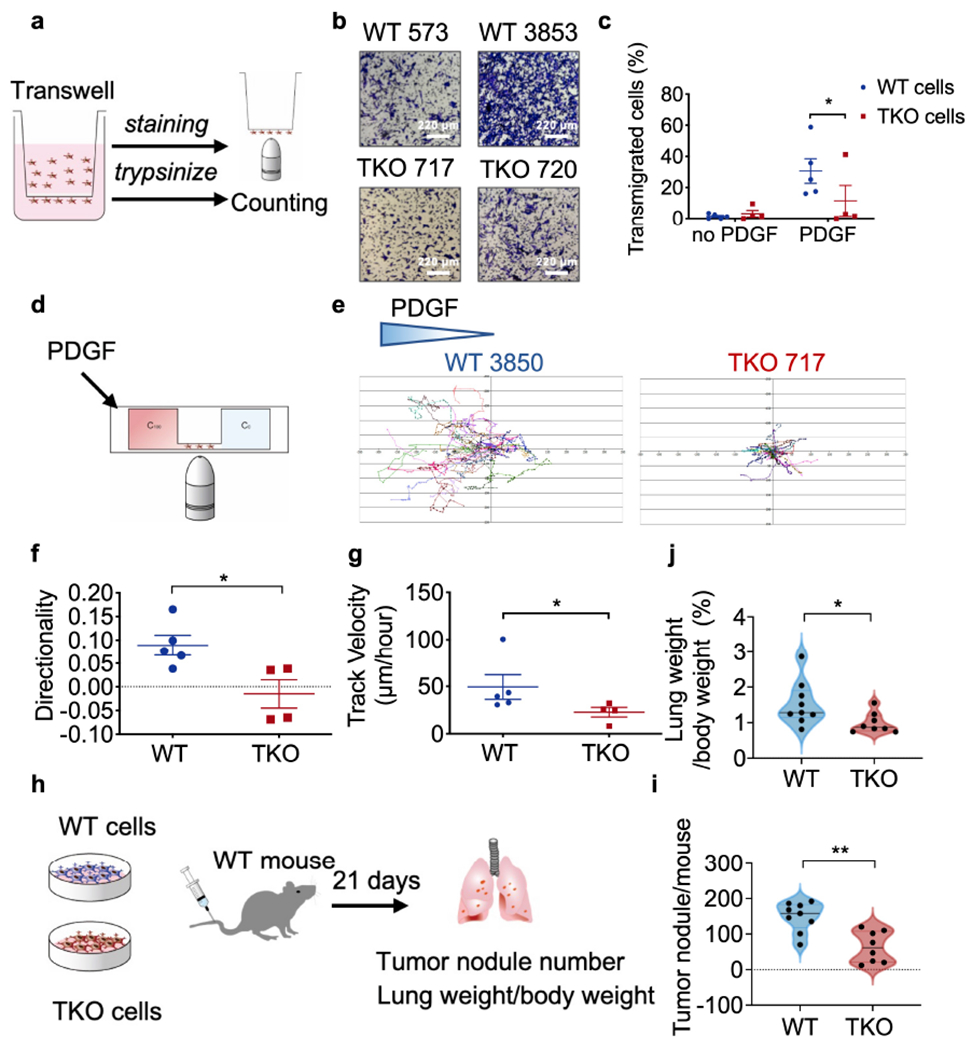
Fig. 2. Roles of TNFAIP8 in tumor cell migration in vitro and tumor cell trafficking in mice.

a, Schematics of experimental design of the transwell assay.
b,c, In vitro transmigration of five WT (573, 604, 2595, 3850 and 3853) and four TKO (717, 719, 720 and 7320) tumor cell lines with or without PDGF treatment for 16 h, as determined by the transwell assay. Representative photographs of 3 experiments (b) and percentages of transmigrated cells (c, p=0.0493) are shown. Scale bars = 220 μm. representative of 3 experiments.
d, Schematics of experimental design of μ-slide migration assay.
e-g, In vitro migration of five WT (573, 604, 2595, 3850 and 3853) and four TKO (717, 719, 720 and 7320) tumor cell lines with or without PDGF stimulation as measured by the μ-slide assay. Representative migration tracks (e), directionality (f, p=0.0317) and speed (g, p=0.0317) of tumor cells from 3 experiments. N=15-20 cells per cell line.
h, Schematics of the experimental model of tumor cell metastasis.
i,j, Tumor nodule numbers in WT mice that were injected i.v. with WT (573, 604, 2595, 3850, 3853) or TKO (717, 719, 720, 7320) tumor cells (i, n=9 mice/group pooled from 3 experiments, p=0.0037), and lung weight as a percentage of the body weight at the end of the experiment (j, p=0.0274).
For all graphs, *p < 0.05; **p < 0.01 vs WT; data are presented as mean ± SEM. Statistical significance was determined by Mann-Whitney U-test (b, f, g, i, j).
