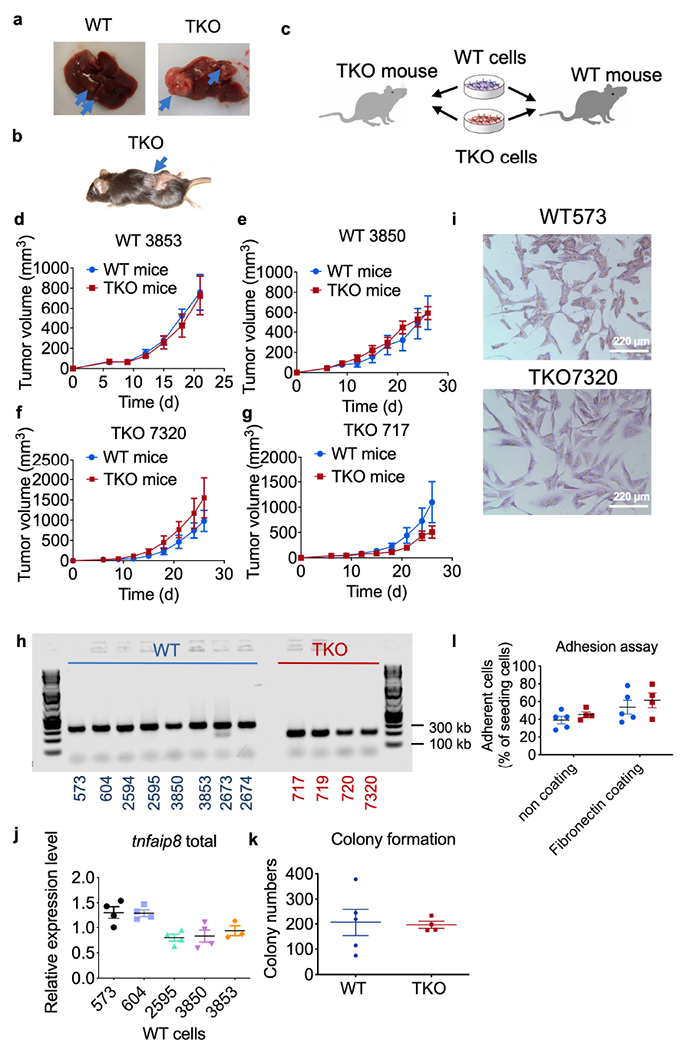
Extended Data Fig. 2. Liver and skin tumor generated after DEN or MCA treatment.

related to Fig. 1.
a,b, Representative tumors developed in the liver (a) and skin (b). The blue arrows pointed to tumors.
c, Schematics of experimental design of tumor inoculation on WT and TKO mice.
d-g, Tumor growth in WT and TKO mice that were injected s.c. with WT (d, e, n=2 WT cell lines) and TKO fibrosarcoma cells (e, f, n=2 TKO cell lines). N=4-5 mice for each cell line. Representative of 2 independent experiments.
h, PCR genotyping results of WT and TKO mice. Representative of 2 independent experiments.
i, Morphology of WT and TKO fibrosarcoma cells stained with crystal violet. Scale bar=220 μm.
j, Relative mRNA levels of tnfaip8 expression in WT fibrosarcoma cells. Representative of 2 independent experiments.
k,l, Colony formation (k) and adhesion abilities (l) of five WT (573, 604, 2595, 3850 and 3853) and four TKO (717, 719, 720 and 7320) fibrosarcoma cell lines. Representative of 3 (l) or 4 (k) independent experiments.
