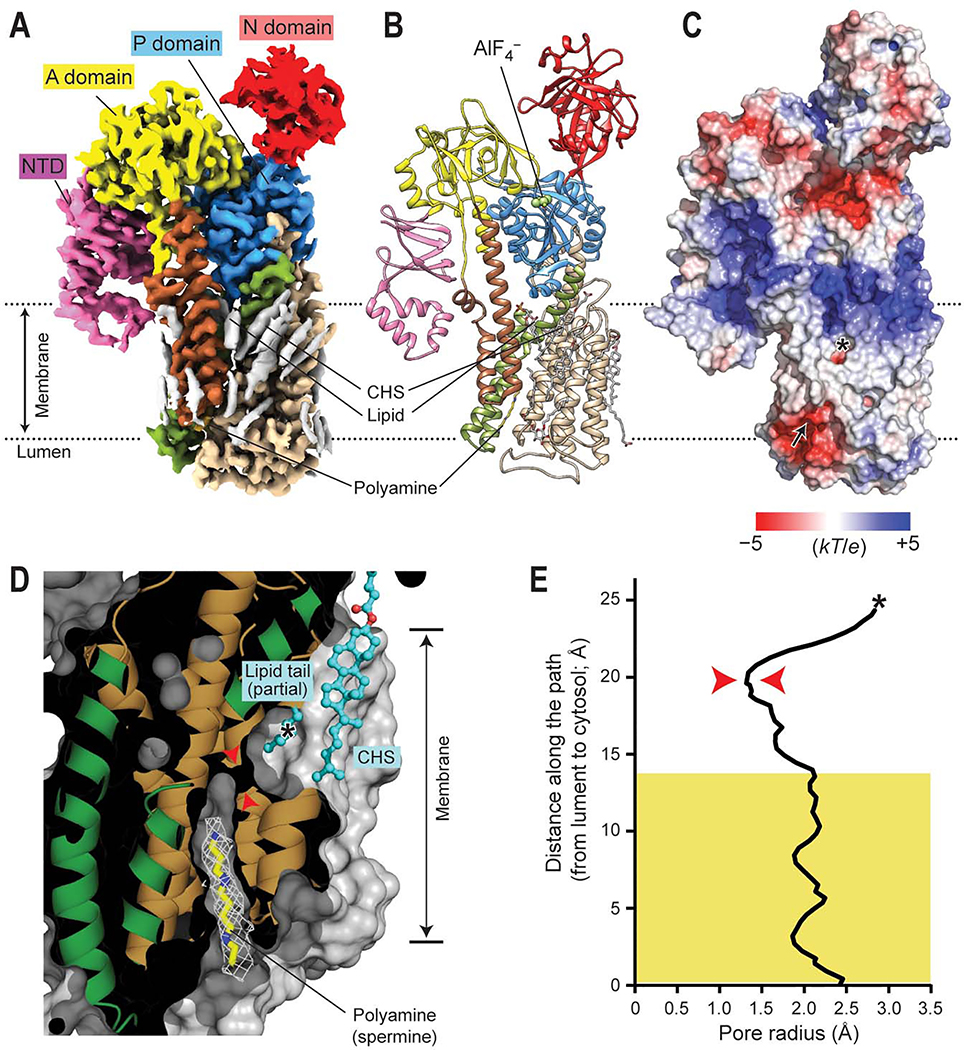
Figure 2. Polyamine-bound E2-Pi structure of ATP13A2.
(A and B) 2.5-Å-resolution cryo-EM map (A) and atomic model (B) of ATP13A2 in the polyamine-bound E2-Pi-like state (E2-AlF4–; map 6). The domains are colored as in Fig. 1A. Gray densities in A are lipids and detergent molecules. (C) Surface electrostatic potential calculated at pH 7. Arrow, polyamine entrance; asterisk, putative polyamine exit (see panel D). (D) Cutaway (side) view of the substrate-binding pocket in the E2-Pi structure (protein surface shown in gray). The view angle is an ~90° right-hand-rotated with respect to that of panels A–C. The observed polyamine (spermine) density is shown as a white mesh. The lipid tail and CHS molecule that sits in front of the putative polyamine exit are shown as cyan balls and sticks. Red arrowheads indicate the narrowest neck of the cavity. The asterisk indicates the position marked by the asterisk in C. Approximate membrane boundaries are also indicated. (E) Radius profile of the transport conduit. The region that spermine spans is marked by a yellow box. Red arrowheads, the narrowest (1.3 Å in radius) region corresponding to the arrowheads marked in D; asterisk, the position marked by the asterisk in C and D.

