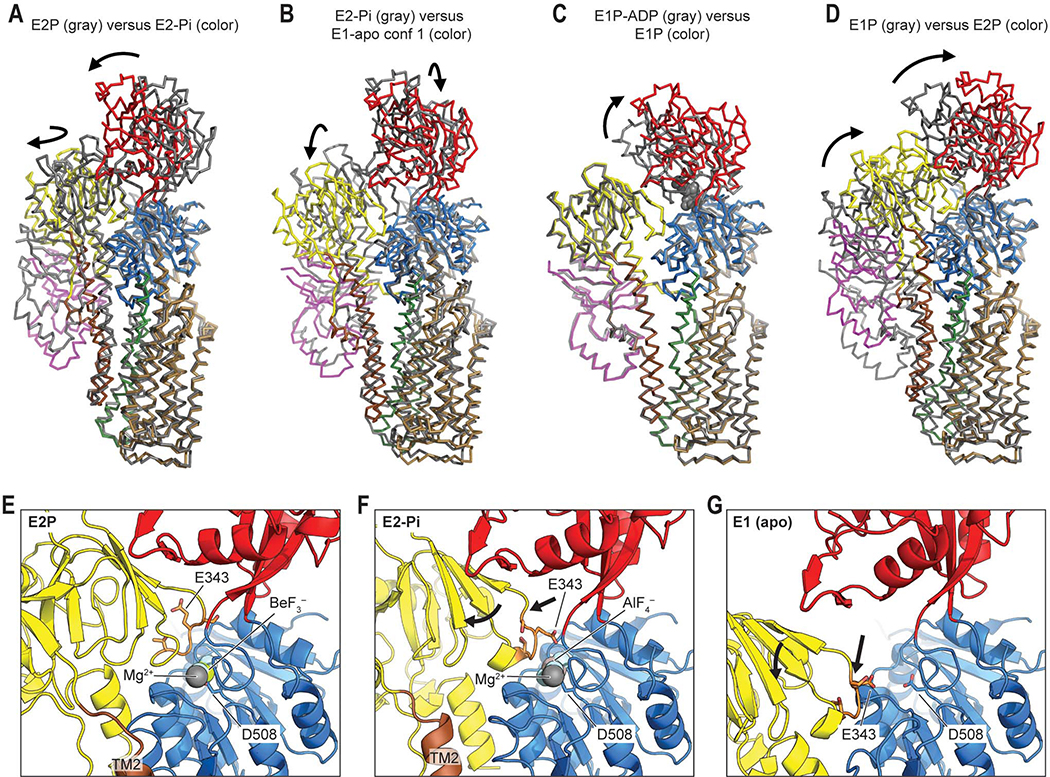
Figure 4. Movements of the cytosolic domains and TMD during the catalytic cycle of ATP13A2.
(A) Structural comparison between E2P and E2-Pi states of ATP13A2. The color scheme is the same as Figs. 1 and 2. Arrows indicate major domain movements between the compared structures. Structures were aligned based on the P domain and TMs 5–10. (B–D) As in A, but comparison between E2-Pi and E1-apo (B), between E1P-ADP and E1P (C), or between E1P and E2P states (D). For RMSDs between structures, see Fig. S8D. (E) View into the phosphorylation site (D508) in the E2P structure. A, P, and N domains are colored yellow, blue, and red, respectively. The TGES loop containing E343 is in orange with side chains shown in a stick representation. (F) As in E, but with the E2-Pi structure. Arrows, overall movements of the TGES loop and A domain from the E2P structure. (G) As in E and F, but with the E1-apo structure. Arrows, overall movements from the E2-Pi state.

