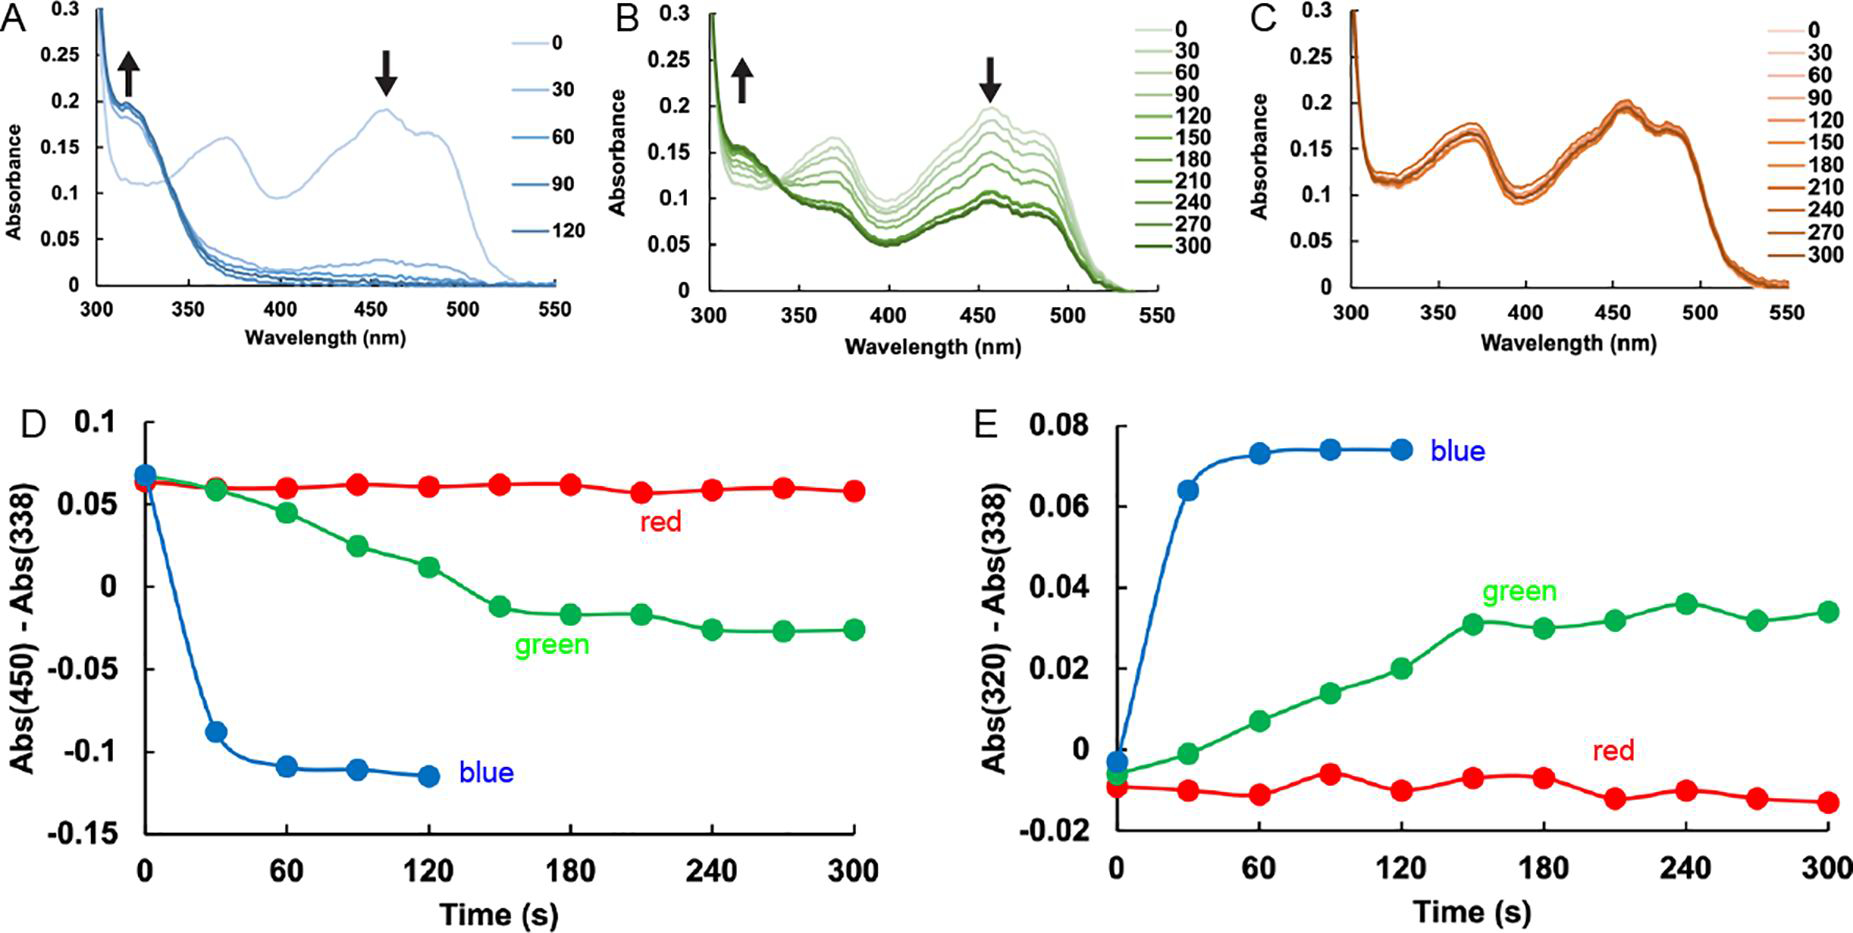
Figure 4.

Wavelength dependence of the inactivation of SmPutA by compound 4. (A-C) Flavin spectral changes measured from SmPutA samples containing 25 mM 4 and exposed to 5 mW lasers emitting (A) blue light (410 nm ±10), (B) green light (530 nm ±10), or (C) red light (650 nm ±10). Spectra were acquired every 30s for a total of 300s. The sample was illuminated with the laser from a distance of 1 cm for 15 seconds between each spectral acquisition. (D) Time dependence of the absorbance at 450 nm for the three light sources, relative to the absorbance at the isosbestic point. The colors of the curves correspond to the color of light used. (E) Time dependence of the absorbance at 320 nm for the three light sources, relative to the absorbance at the isosbestic point. The colors of the curves correspond to the color of light used.
