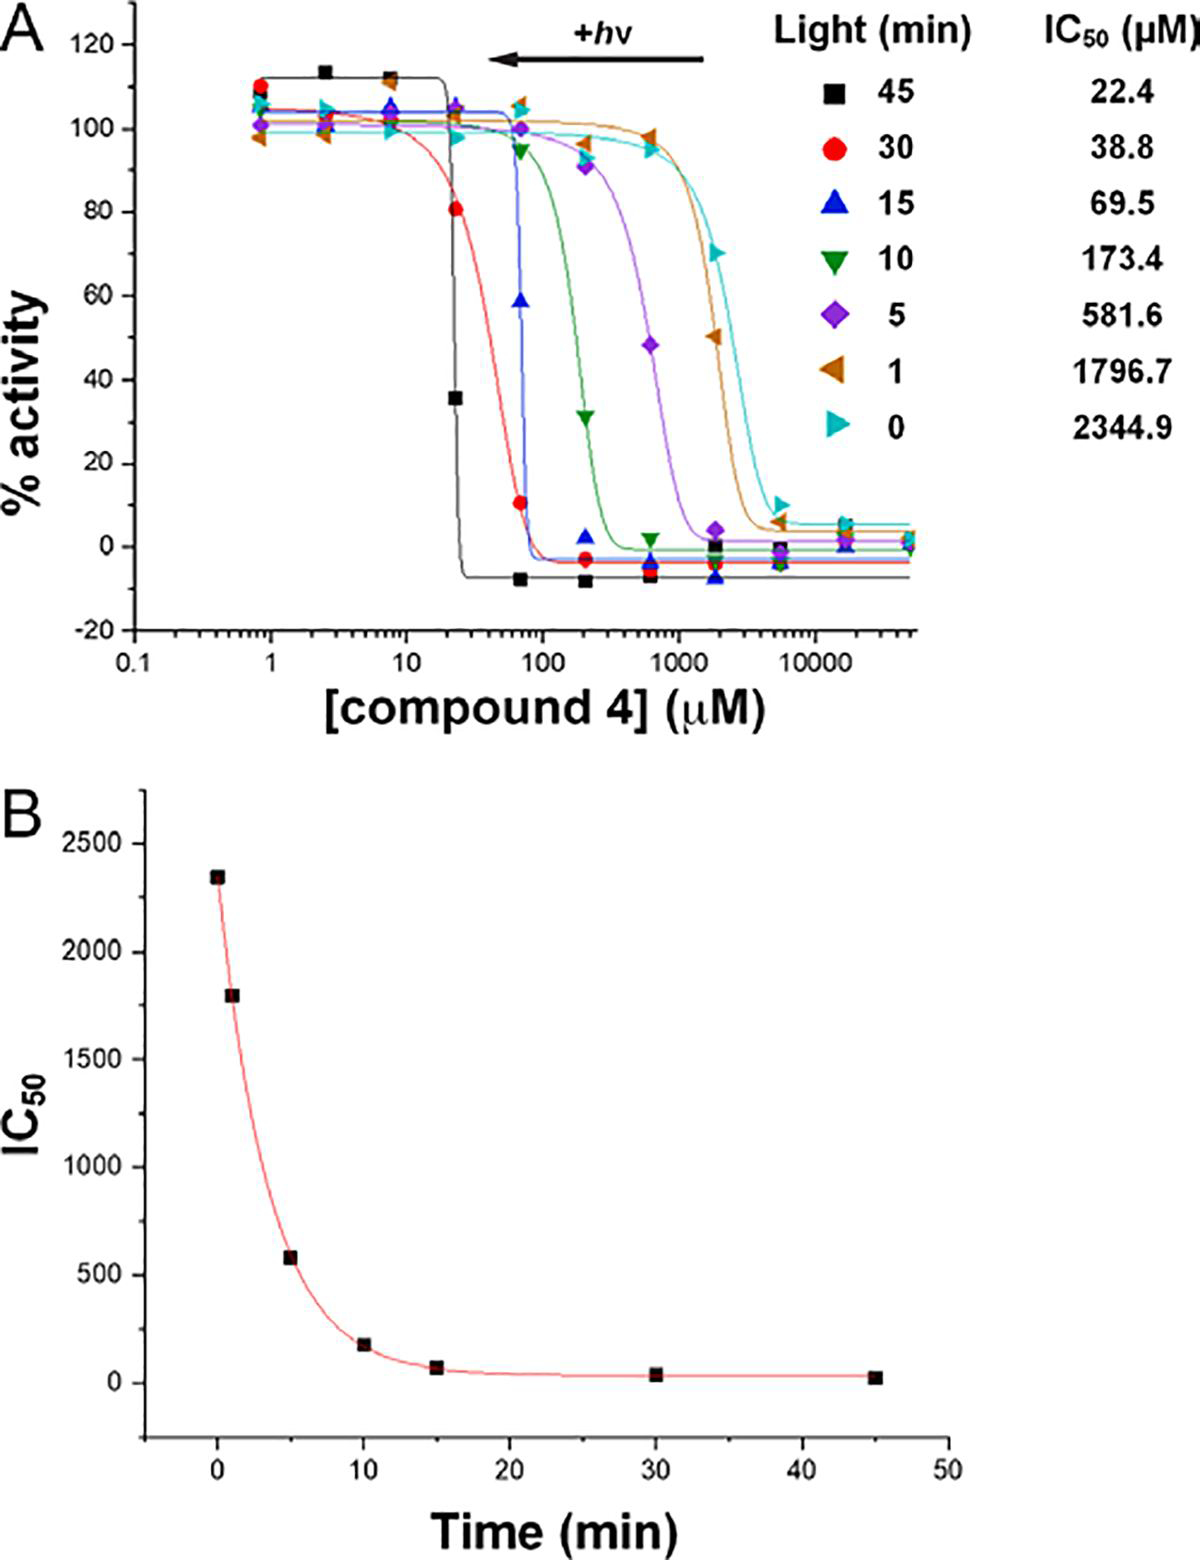
Figure 5.

Kinetics of photoinduced covalent inactivation of PRODH by compound 4. (A) PRODH activity remaining after incubating the enzyme with 4 at various concentrations and exposing the sample to white light for various times. The curves represent fits to a dose-response function calculated with Origin software. (B) Dependence of the apparent IC50 on illumination time. The curve represents the fit to an exponential decay function (y = Aexp(−x/τ) + y0) calculated with Origin software. The decay time constant and offset from fitting are τ=3.53 ± 0.06 min and y0 = 32 ± 8 μM.
