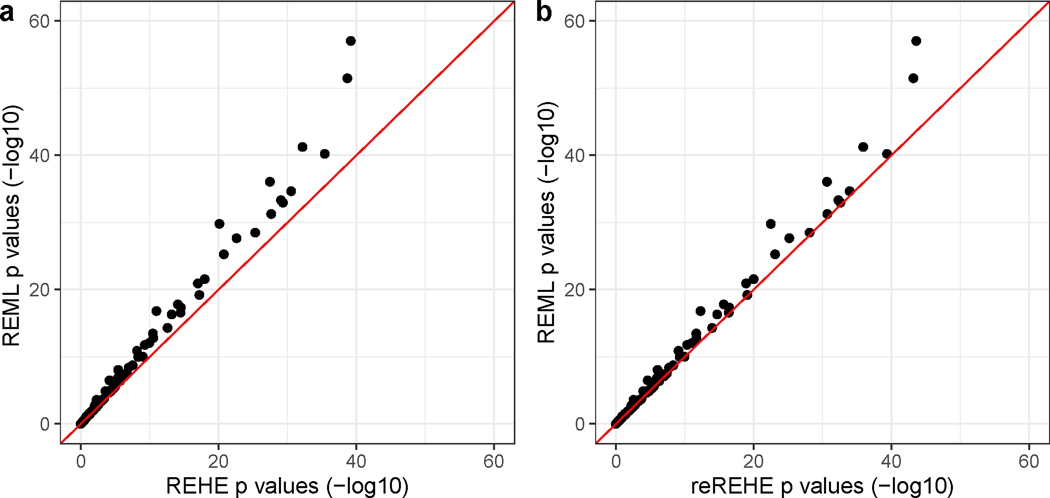
Figure 2:
Results of network-based pathway enrichment analysis based on a breast cancer data set. -values ( scale) of t-tests for group difference of each gene pathway: a - compare REHE results against REML results; b - compare reREHE results against REML results. Two out-of-range data points are omitted from the plots, which correspond to: Glycosphingolipid biosynthesis - lacto and neolacto series pathway, with -value by REML, by REHE, by reREHE; and Caffeine metabolism pathway with -value by REML, by REHE, and by reREHE.

