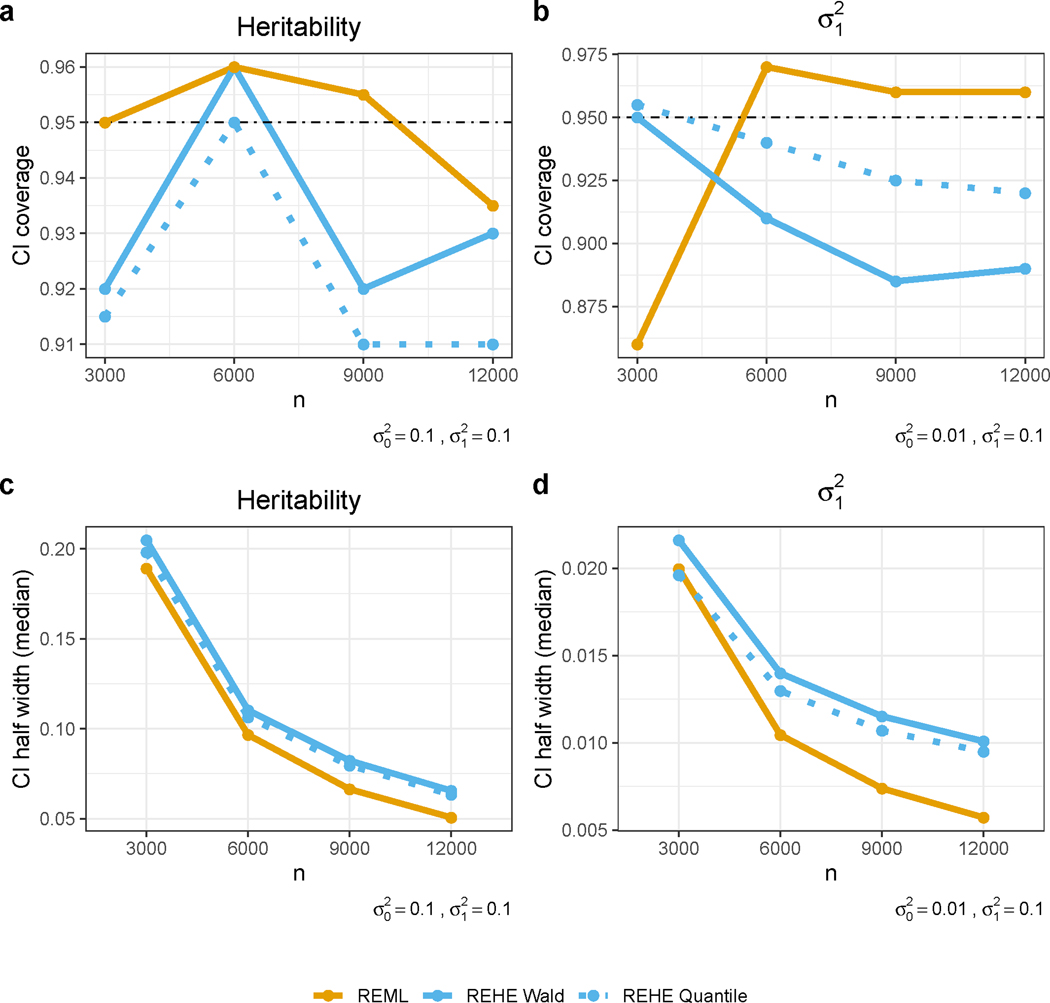
Figure 4:
Simulation results for confidence interval performance in terms of coverage and width. is the variance for noise, and is the variance for the random effect. a - Coverage for heritability confidence interval (CI); simulation was based on true values . Monte Carlo error of 0.03 is expected for 200 simulation replications. b - Coverage for CI; simulation was based on true values . Monte Carlo error of 0.03 is expected for 200 simulation replicates. c - Line charts of median half width of heritability CI with increasing sample sizes; simulation was based on true values . d - Line charts of median half width of CI with increasing sample sizes; simulation was based on true values .

