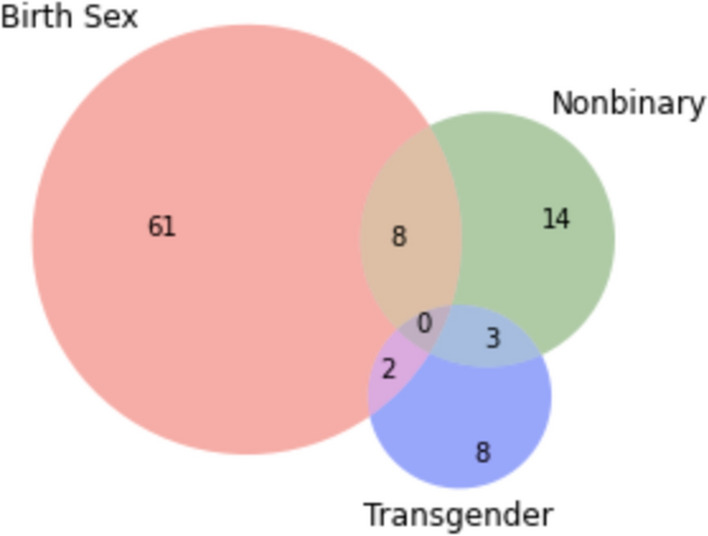
Fig. 1.

Distribution of participants’ current gender identification (after detransition) (n = 100). Notes: The sum of the numbers appearing in the “Birth Sex” circle indicates the number of participants who returned to identifying with their birth sex (71)—either as birth sex alone (61) or birth sex in addition to a second identification (10) represented in the overlap between two circles. For example, eight participants identify as their birth sex and as nonbinary. The sum of the numbers appearing in the “Nonbinary” circle indicates the number of participants who identify as nonbinary (25)—either as nonbinary alone (14) or nonbinary in addition to a second identification (11). The sum of the numbers appearing in the “Transgender” circle indicates the number of participants who identify as transgender (13)—either as transgender alone (8) or transgender in addition to a second identification (5). Four participants had responses that did not fit the categories above and were coded as “other”
