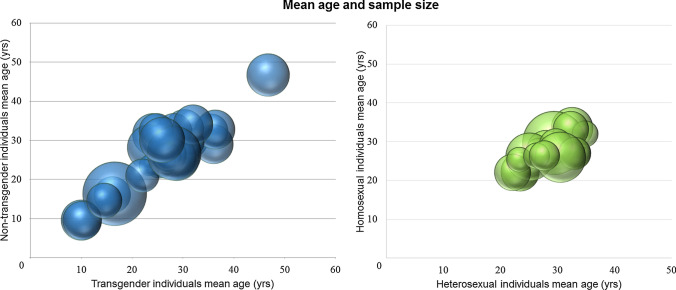
Fig. 3.
3D bubble charts of the mean age and sample size of: a cisgenders and transgenders involved in the selected studies (left) (Note: the graph does not include the study by Yokota et al., 2005 because of the lack of data), and b heterosexuals and homosexuals involved in the selected studies (right) (Note: the graph does not include the study by Hu et al., 2011 because of the lack of data. Four studies (Kagerer et al., 2011; Perry et al., 2013; Sylva, 2013; Zeki & Romaya, 2010) reported just the mean age of all the sample size, and we assumed that it was the same in heterosexual and homosexual subsamples)

