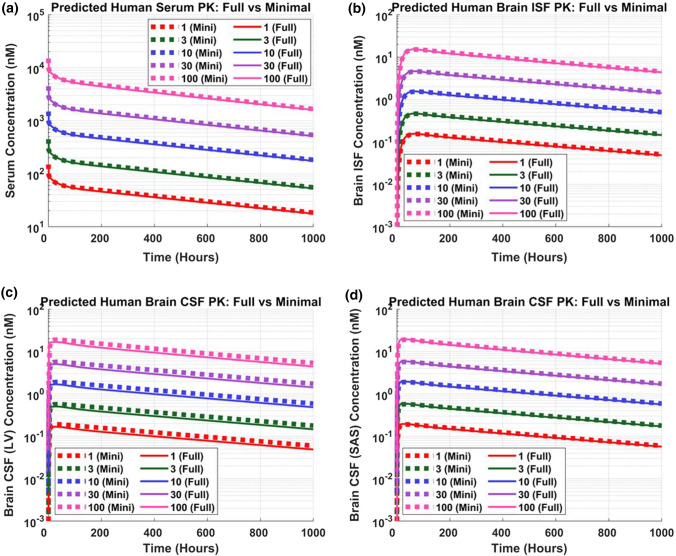
Fig. 3.
Minimal versus full PBPK model predictions. Antibody concentrations in human a serum, b brain interstitial fluid (ISF), c brain CSF in lateral ventricle (LV), and d brain CSF in subarachnoid space (SAS). Five IV doses were simulated 1 (red), 3 (green), 10 (blue), 30 (purple), and 100 (pink) mg/kg for a duration of 1000 h. Dotted and solid lines represent minimal and full PBPK model simulations, respectively (Color figure online)

