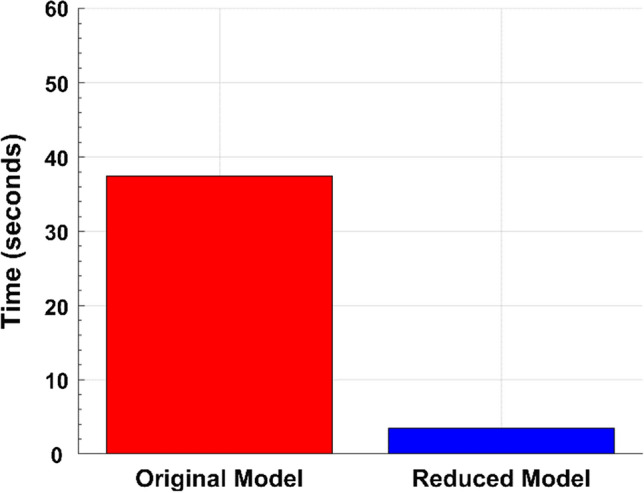
Fig. 4.

Computational speed improvement. Simulation time differences between the original/full (red) and reduced/minimal (blue) PBPK models. Simulations were performed for 5 doses over 1000 h for each species, using a solver step size of 0.01 h. The differential equation solver used was ode15s using a relative and absolute tolerance of 2.3E−14 and 1E−22, respectively. Each bar represents the average simulation time across four simulations, one simulation per species. Processor: Intel i7-8700K CPU @ 3.70 GHz (Color figure online)
