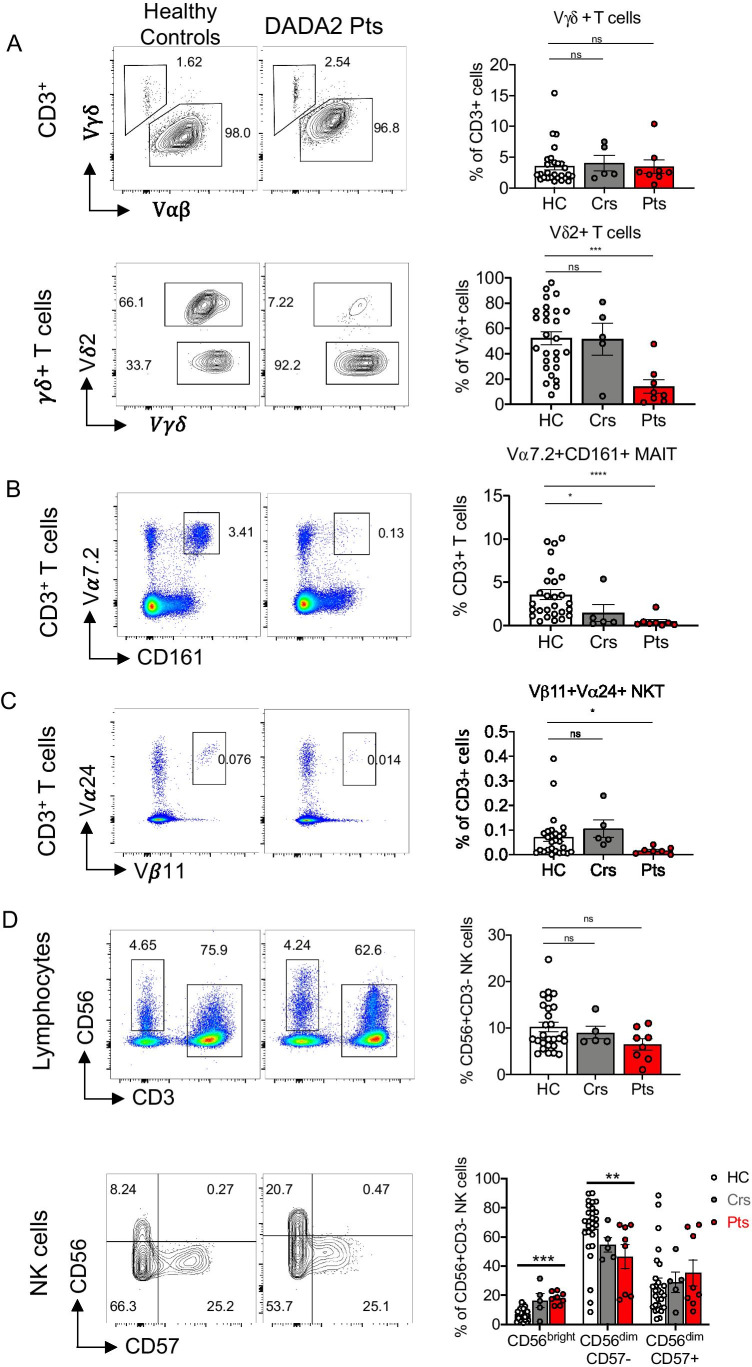
Fig. 6.
Diminished unconventional T cells and NK cell subsets in DADA2 patients. Proportions of A γδ+ T cells (top) and Vδ2+ within γδ+ T cells (bottom), B Vα7.2+CD161+ MAIT cells, and C Vβ11+Vα24+ NKT were analyzed in healthy donors, heterozygous carriers and DADA2 patients, presented as flow cytometry plots (A-C left) and summarized in graphs (A–C right). D representative flow cytometry plots showing total CD56+CD3− NK cells as a proportion of lymphocytes (top), and proportions of immature CD56bright, mature CD56dimCD57− and terminally differentiated CD57dimCD57+ NK cell subsets within the total NK cell population (bottom). Graphs represent the mean ± S.E.M.; each symbol represents an individual. Significant differences were determined by Mann–Whitney t-tests with *P < 0.05; **P < 0.01; ***P < 0.001; ****P < 0.0001. A–D or multiple t-tests with P < 0.05 indicating statistical significance (D bottom)

