Fig. 6.
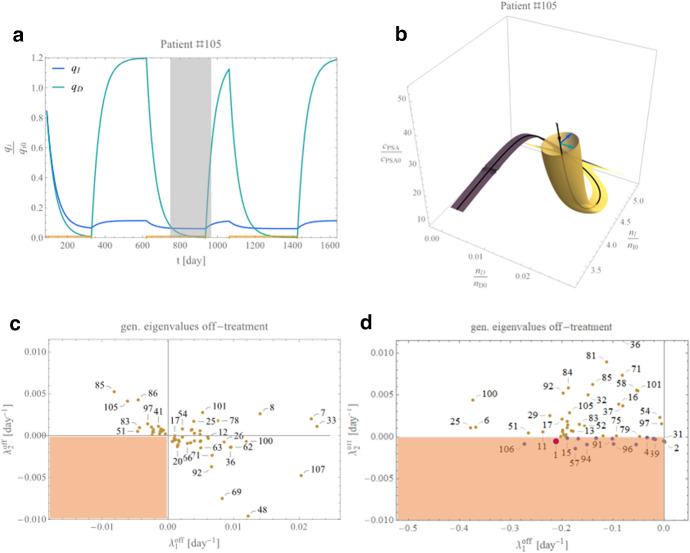
Portz et al. model analysis results. a Quotas for dependent and independent cells shaping the tube plot of panel b for a particular patient. The yellow dot–lines represent the on-treatment periods, and blue and green are the model’s independent and dependent quota levels, respectively. b The quota profiles are represented as a cross section. The orbital evolution corresponds to the gray box time interval in panel a. The blue and green arrows represent the independent and dependent quota levels of the model, respectively. On the orbit section, the tube cross section has been computed considering qD along the normal N and qI along the binormal B and by solving the Frenet–Serret formulas (assuming the vector field of the system under consideration being along the tangent T). c, d The distribution of the eigenvalues and off-treatment for models P12B and P12A, respectively (Color figure online)

