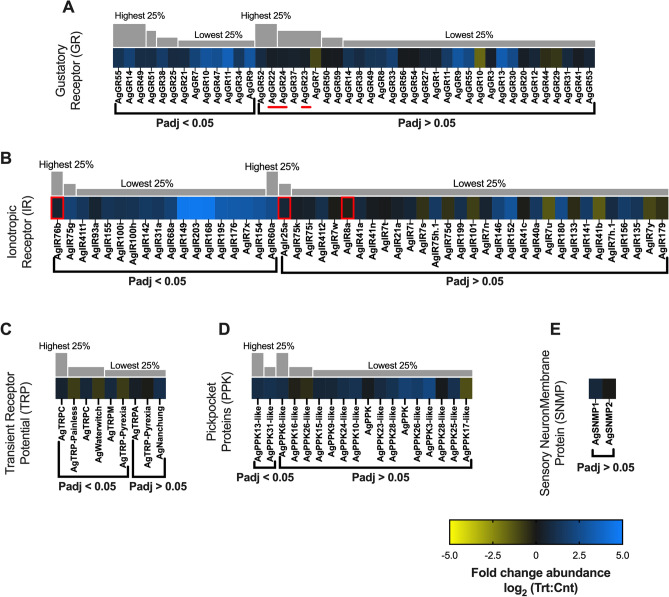
Figure 7.
Chemosensory differential transcript abundances following relevant sporozoite infections. Chemosensory transcripts that were present at significantly higher (blue) or lower (yellow) levels in Plasmodium falciparum sporozoite infected treatments; non-differentially expressed chemosensory transcripts are denoted as zeros (black). Chemosensory genes within each family organized by adjusted p-value and subsequently arrayed left to right from most abundant to least abundant based on FPKM values (quartile bars above each image). (A) Gustatory receptor family (GR). (B) Ionotropic receptor family (IR). (C) Transient receptor potential family (TRP). (D) Pickpocket protein family (PPK). (E) Sensory neuron membrane protein family (SNMP). Chemosensory co-receptors are identified by red boxes. The three CO2 gustatory receptors are identified by a red line. Log2 scale indicates transcript abundances that were significantly higher (blue) or lower (yellow) in sporozoite infected treatments (Trt) vs. naïve controls (Cnt).

