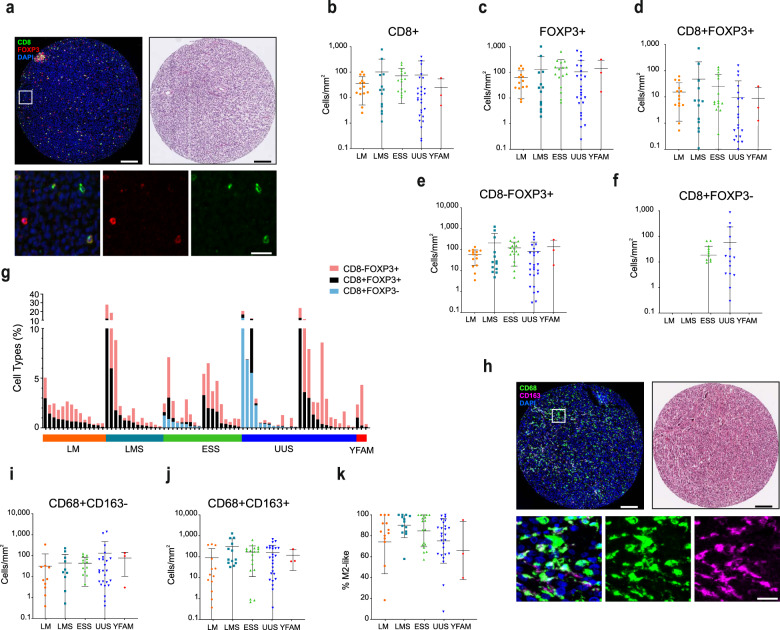
Fig. 1. T cell and macrophage infiltration is highly heterogeneous in uterine mesenchymal tumors.
a IF staining of a representative example of a tumor with infiltrated T cells (left), and its corresponding H&E staining (right), and representative images of single and double staining for CD8 and FOXP3 (bottom). Upper scale bars indicate 100 μm and lower panel scale bar indicates 20 μm. b–f Quantification of T cell densities shows heterogeneity in overall CD8+ (b), overall FOXP3+ (c), CD8+FOXP3+ (d), and CD8-FOXP3+ (e) in leiomyoma (LM), leiomyosarcoma (LMS), endometrial stromal sarcoma (ESS), undifferentiated uterine sarcoma (UUS), and YFAM translocation-bearing ESS. f CD8+FOXP3- cells are found in ESS and UUS but not in LM or LMS tumors. g Proportion of T cell types in individual patients. h Representative IF staining of macrophages (left), their corresponding H&E staining (right), and representative examples of single and double CD68- and CD163-expressing cells (bottom). Upper scale bars indicate 100 μm and lower panel scale bar indicates 20 μm. i, j Quantification of macrophage densities shows heterogeneity in overall CD68+ CD163− (i) and CD68+ CD163+ (j) infiltration. k Percentage of macrophages with M2-like phenotype. Plots indicate average ± s.d.

