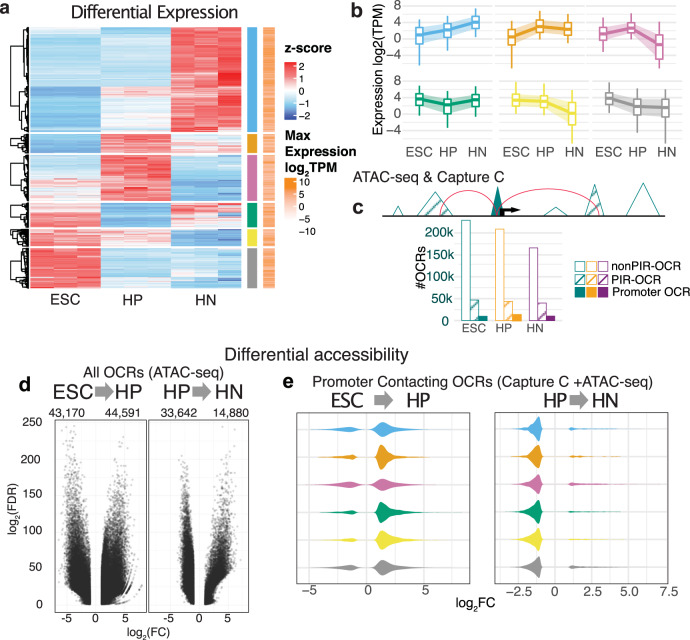
Fig. 2. Changes in gene expression and chromatin architecture underlying hypothalamic neuron differentiation.
a Heatmap of the scaled expression values (z-score) of each RNA-seq sample of ESC, HP, and HN for the 15,808 genes with differential expression in at least one stage of differentiation. Red indicates higher relative expression, while blue indicates lower relative expression. From hierarchical clustering, the genes were assigned to six groups based on their expression pattern pointed to being either specifically enriched or depleted in one condition (blue, orange, pink, green, yellow, gray bars). The log-transformed condition-wise max TPM value for each gene is plotted where white indicates lower expression and orange indicates higher expression compared to other genes. b The global average of expression values (TPM) of the genes in each cluster. The central line of each boxplot represents the median, with edges representing the 25 and 75 percentiles, and whiskers represent the 5 and 95 percentiles. c Sets of OCRs were assigned based on location: promoter OCRs (solid), PIR-OCRs (hashed), and non-PIR-OCRs the remaining OCRs that were not annotated to a gene (promoter OCR- ESCs: 9796, HPs: 12,962, HNs: 10,241; PIR-OCR- ESCs: 46,968, HPs: 43,860, HNs: 39,942; non-PIR-OCR ESC: 228,747, HP: 208,763, HN: 165,860). Bottom: the distribution of number OCRs annotated to each set per cell type. d Volcano plot depicting the global genome-wide significant differentially accessible OCRs in the transition from ESC to HP (left) and HP to HN (right). e Distribution of chromatin accessibility fold change of cRE annotated to DE gene clusters (a).

