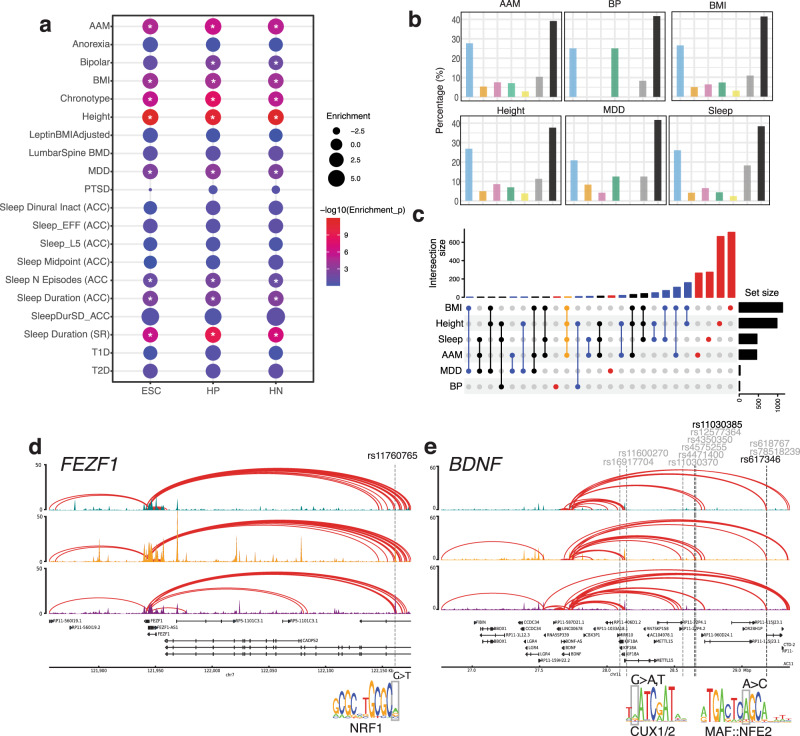
Fig. 4. Putative cis-regulatory elements are enriched for GWAS signals of complex traits.
a Partitioned LD score regression of ESC, HP, and HN cRE against the indicated genome-wide signal. Circle size indicates the enrichment of estimated heritability, and color indicates statistical significance. b Proportion of genes from our variant-to-gene mapping located in each DE cluster (Fig. 2a) or non-DE genes (black). c Comparison of genes implicated in our variant-to-gene mapping analysis for each GWAS. Dots and lines indicate the intersect of the set of genes found in each GWAS. Top: the number of genes in different overlapping sets. Right: the number of SNPs detected in each GWAS. d FEZF1 genomic locus with interactions connecting to a distal cRE. The SNP is located in a putative NRF1 motif. e Genome track for the BDNF locus. Multiple proxies in open regions are shown. Two proxies located in putative TF motifs for CUX1/2 and MAF::NFE2 are shown.

