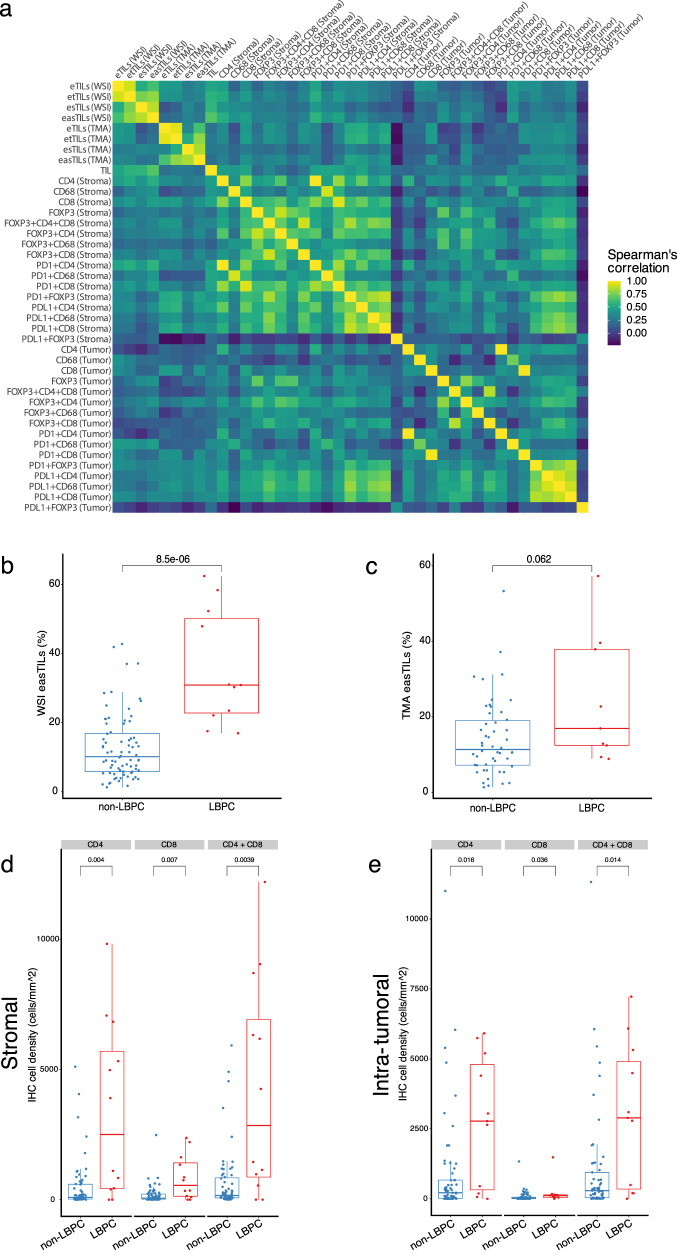
Fig. 3. Correlations of TILs with multiplex IHC.
a Correlation matrix of the different variables derived from multiplex fluorescent IHC, manual and digital TILs scoring; Correlations of easTILs in whole-slide images (b) and TMA (c) with manual TILs scoring in lymphocyte-predominant breast cancer (LPBC) and non-LPBC; Correlation between CD4 and CD8 stromal (d) and intra-tumoral (e) immune cell subsets with LPBC and non-LPBC based on manual TILs scoring.; In the boxplots, each box extends from the 25th to the 75th percentile, the midline represents the median, and the whiskers extend from –1.5 × IQR to +1.5 × IQR from the closest quartile, where IQR is the inter-quartile range; WSI: whole-slide images, TMA: tissue microarrays.

