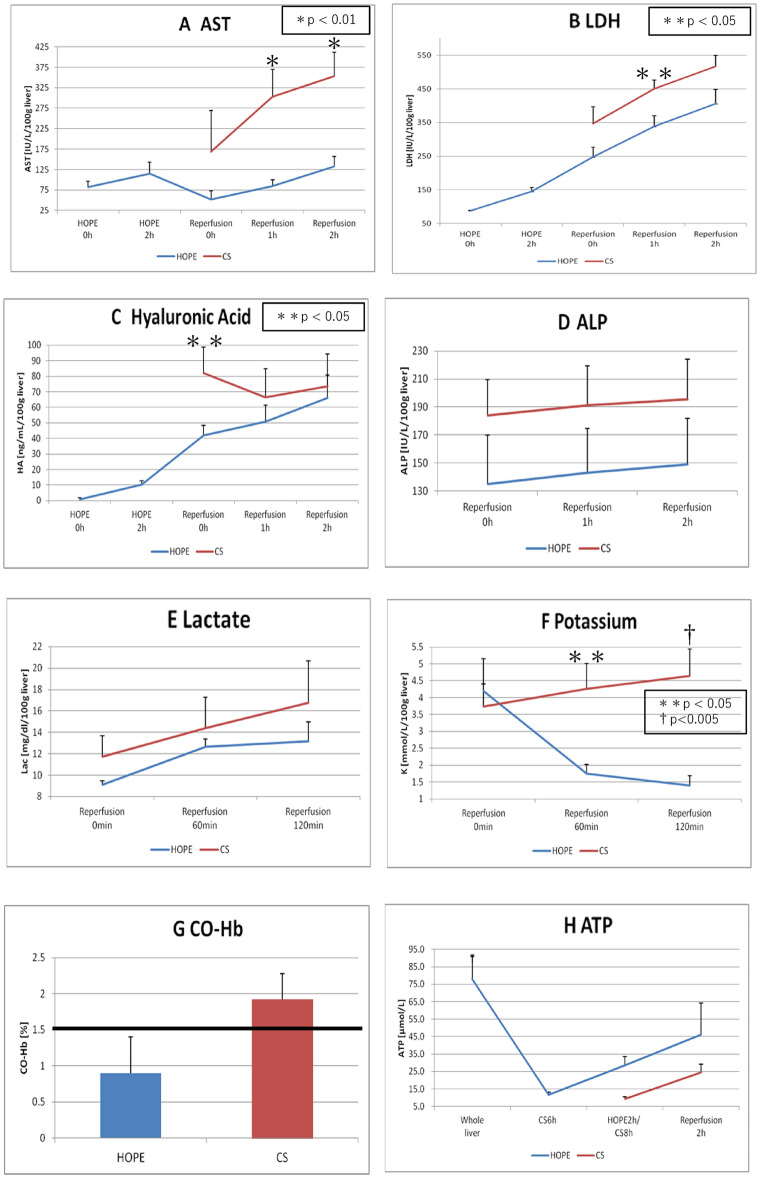
Figure 3.
Laboratorial results. (A) Aspartate aminotransferase concentration (IU/L/100 g liver), (B) lactate dehydrogenase concentration (IU/L/100 g liver), (C) hyaluronic acid concentration (ng/mL/100 g liver), (D) alkaline phosphatase concentration (IU/L/100 g liver), (E) lactate concentration (mg/dL/100gliver), and (F) potassium concentration (mmol/L/100 g liver) value (mean ± SD) in the perfusate over time (hours) during HOPE and ERM. (G) Carboxyhemoglobin concentration (%) values (mean ± SD) in the perfusate at 2 h after ERM. (H) Tissue adenosine triphosphate level (μmol/L) values (mean ± SD) after laparotomy, after preservation (simple cold storage [CS] and HOPE), and at 2 h after isolated ERM. ERM ex vivo reperfusion model, HOPE hypothermic oxygenated machine perfusion preservation, SD standard deviation.

