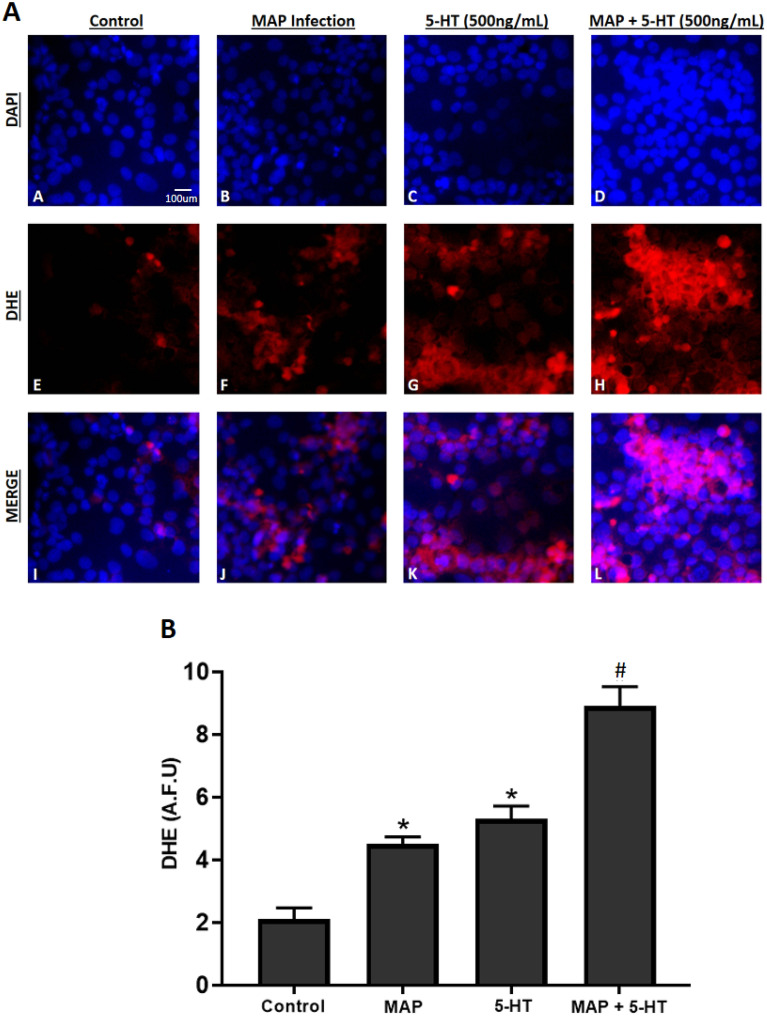
Figure 6.
(A) Effect of MAP infection on oxidative stress level in Caco-2 monolayers in the presence of excess level (500 ng/mL) of 5-HT following 24 h of incubation. Total nuclei are stained with DAPI in blue (A–D). DHE positive cells are stained in red (E–H), and merged cells are presented in pink (I–L). (B) Quantitative corrected DHE fluorescence integrated density from control and treated groups. Values were pre-tested for normal distribution using the Kolmogorov–Smirnov normality test. Significance among experiments was assessed by two-way analysis of variance (ANOVA) followed by Bonferroni correction test. All DHE fluorescence staining experiments were performed in triplicates. Data are presented as Mean ± SD. *P value < 0.05 compared to no treatment control. #P value < 0.05 compared to no treatment control, MAP, and 5-HT values.

