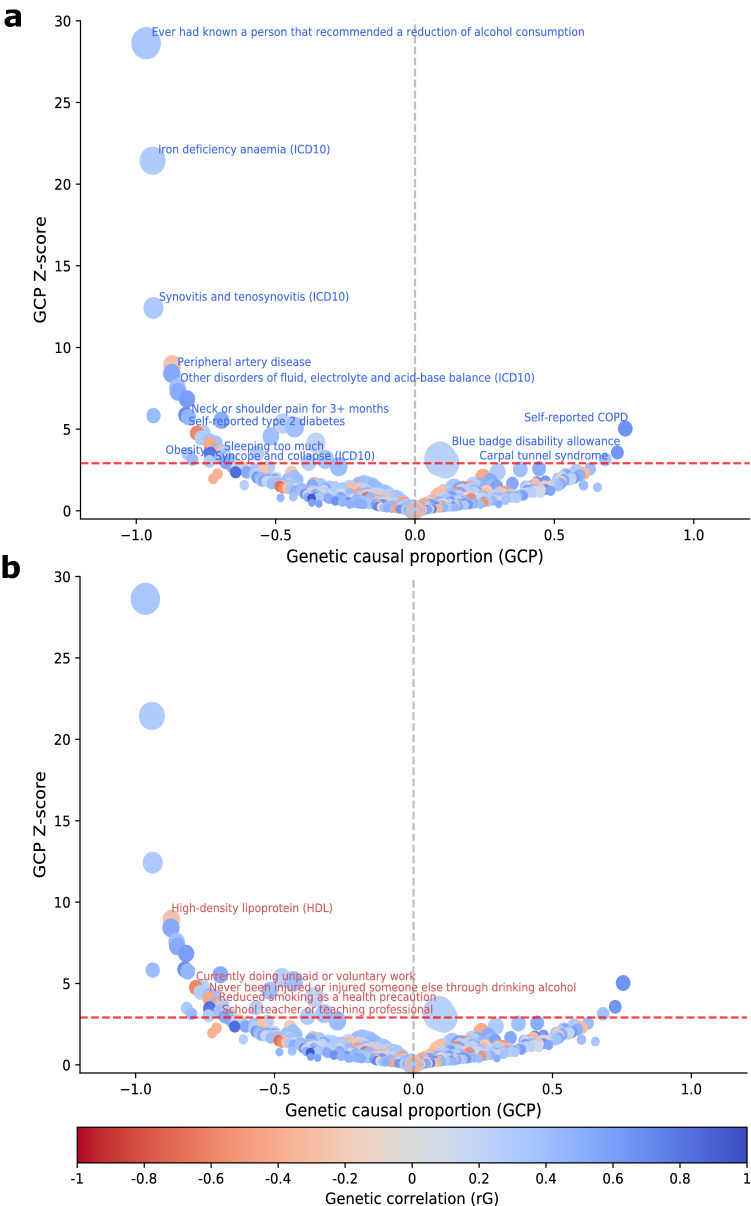
Figure 1.
Causal architecture of ADHD. Causal architecture plots illustrating results from the phenome-wide analysis. Each dot represents a trait with genetic overlap with ADHD. The x-axis shows the GCP estimate, and the y-axis shows the genetic causal proportion (GCP) absolute Z-score (as a measure of statistical significance). The red dashed lines represent the statistical significance threshold (FDR < 5%). The division for traits causally influencing ADHD (on the left) and traits causally influenced by ADHD (on the right) is represented by the grey dashed lines. Results are shown separately for traits with a positive genetic correlation with ADHD (a) and a negative genetic correlation with ADHD (b). A GCP = 0 indicates that horizontal pleiotropic effects mediate the genetic correlation (i.e., provides no evidence for genetic causality between the phenotypes), whereas a |GCP| = 1 represents full genetic causality. A |GCP| < 0.60 represents limited partial genetic causality. A detailed description of how to interpret these plots is available in previous studies46,47.

