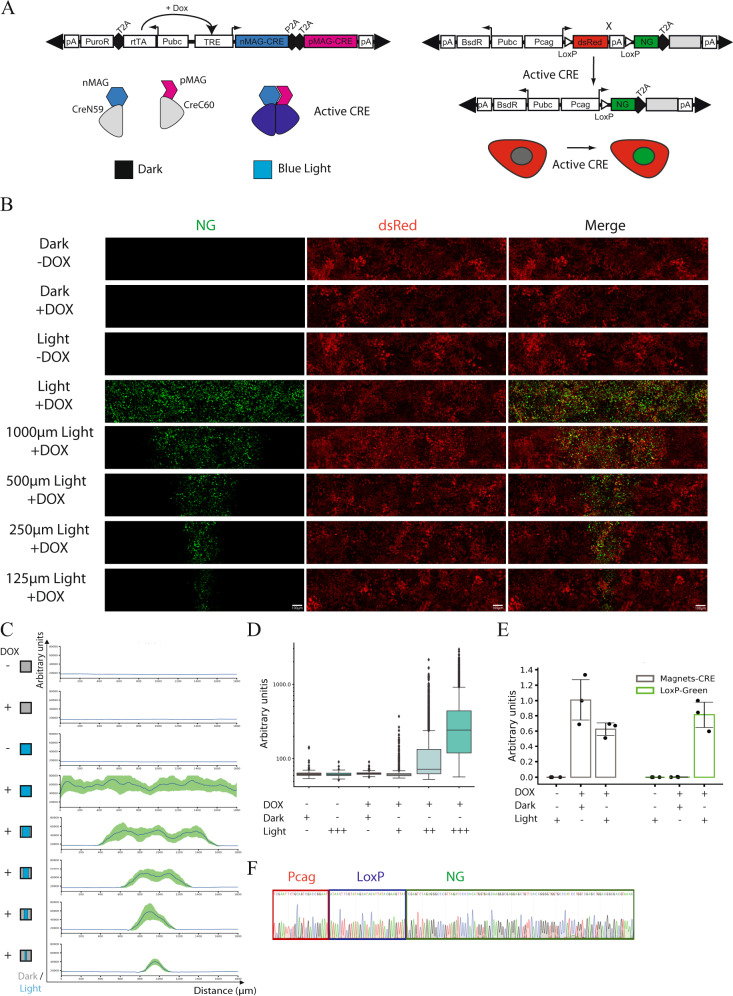
Fig. 1. Light-induced gene expression programs in hESCs.
A Schematization of the collection of optogenetic ePiggyBac vectors to conditionally express a photoactivatable Cre-loxP recombinase vector. Left panel. Puromycin selectable and Dox inducible piggyBac transposon carrying the CRE-MAGNETs system. Dox treatment induces the CRE-MAGNETs system which reconstitutes a fully active CRE in the presence of blue light. Right panel. Blasticidin selectable LoxP exchangeable dual colors piggyBac transposon. The first ORF (Red module) is constitutive expresses while the second ORF (Green module) depends on CRE-LoxP recombination. Gray Box is the possible cargo protein taking advantage of the T2A peptide. B Photomask induced light patterns showing the expression of the Red module (dsRed), Green module (NG) and merge composite channel. Dark control and spatially localized activation in presence and absence of DOX with different spatial features are shown (1000 μm, 500 μm, 250 μm, 125 μm). Scale bar: 100 μm. C Cumulative fluorescence intensity analysis (line profile) over the x-axis. x-axis displays the linear distance in μm. y-axis reports the cumulative fluorescent intensity profile in arbitrary units. Line profile shows the average (line) and SD (area) for the Green fluorescent channel. Quantification after 600 cycles (24 h) of pulsed Blue light (n = 3 biologically independent samples). D Single-cell fluorescent intensity quantification. Conditions: presence or absence of Dox with concomitant Dark or Light stimulation. We titrated the time of light stimulation using different pulsed light conditions. 1 cycle of pulsed light is equal to 20 s Light-ON and 120 s Light-OFF. The light stimulation intervals are 1 cycle, 25 cycles (1 h), and 600 cycles (24 h), data are displayed as a boxplot where center lines show the medians, box limits indicate the 25th and 75th percentiles and whiskers extend to minimum and maximum values (n = 5 biologically independent samples). E qRT-PCR showing mRNA induction of the MAGNETs system and light-induced expression of the Green module, data are displayed as mean and SD (n = 3 biologically independent samples). F Sanger sequencing of the genomic region flanking the LoxP site showing the recombination of the Red module and the generation of the Green module (Red box: Pcag-promoter, Blue box: LoxP, Green box: NG).

