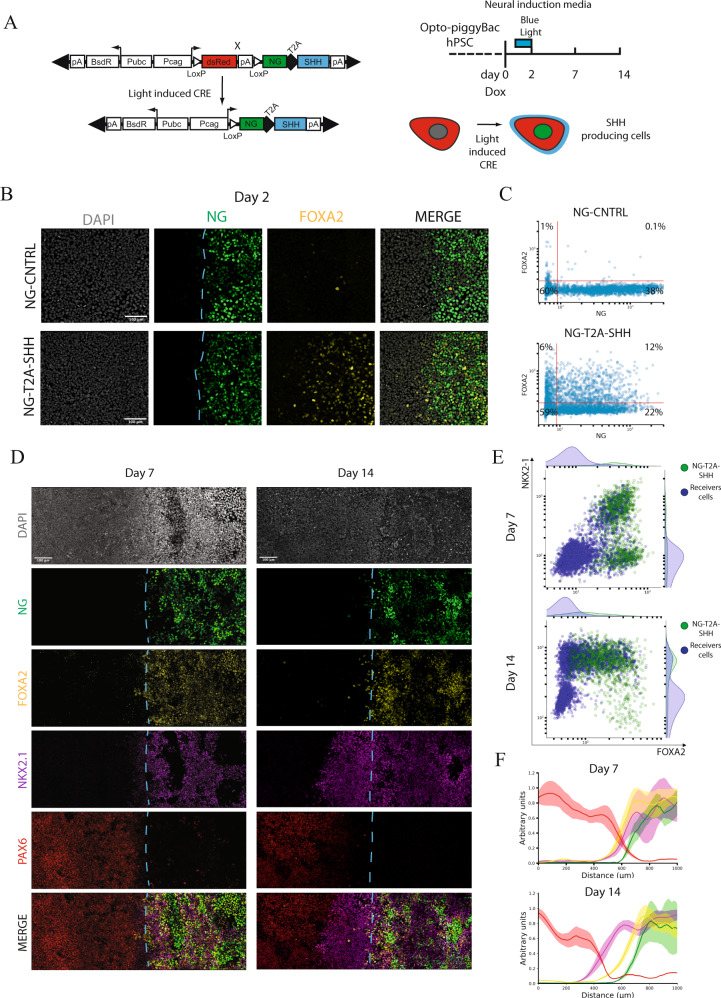
Fig. 2. Medio-lateral neural patterning by light-induced SHH.
A Left panel. Schematization of Green module T2A human SHH. This setup allows conditional expression of SHH and fluorescent visualization of the light-induced cells. Right panel. Schematization of Blue-light stimulation and neural induction reporting analyzed time points. Neural induction is induced by inhibiting TGFβ signaling by dual SMADs inhibition that is maintained during the entire course of differentiation (14 days). Dox treatment starts at day “0” and it is washed-out at day “2”. B FOXA2 immunostaining in light induced SHH cells and NG-CNTRL during differentiation at day 2. DAPI-Gray, NG-Green, FOXA2-Yellow, Merge-Composite. Dashed cyan line indicates the border of SHH producing cells. Scale bar: 100μm. C Day 2 single-cell fluorescence quantification displayed as a scatterplot, reporting FOXA2 and NeonGreen (NG) intensity for NG-CNTRL and NG-T2A-SHH. D Immunostaining time-course analysis of the dorsal and ventral fates, revealing NG-Green (Organizer), FOXA2-Yellow (Ventral floor plate), NKX2-1-Magenta (Ventral neural progenitors), PAX6-Red (Dorsal neural progenitors), Merge-Composite at day 7 and day 14 during neural differentiation in response to ligh patterned SHH. Dashed cyan line indicates the border of SHH producing cells. Scale bar: 100 μm. E Single-cell fluorescence quantification of NG-T2A-SHH induced cells displayed as combined scatterplot and density histogram at day 7 (top) and day 14 (bottom). x-axis report FOXA2 while the y-axis the NKX2-1 fluorescence intensity profile. Each dot represents an individual cell that has been color coded according to its green module status. The green dots represent the NG-T2A-SHH positive cells, while the blue dots are NG-T2A-SHH negative cells. F Cumulative fluorescence intensity analysis (line profile) over the x-axis. x-axis displays the linear distance in μm. y-axis reports the cumulative fluorescent intensity profile in arbitrary units for each channel. Line profile shows the average (line) and SD (area) for each channel. The line profile is color-coded as the immunofluorescent channels, NG-Green, FOXA2-Yellow, NKX2-1-Magenta, PAX6-Red. Top panel. Day 7 quantification (n = 4 biologically independent samples). Bottom panel. Day 14 quantification (n = 4 biologically independent samples).

