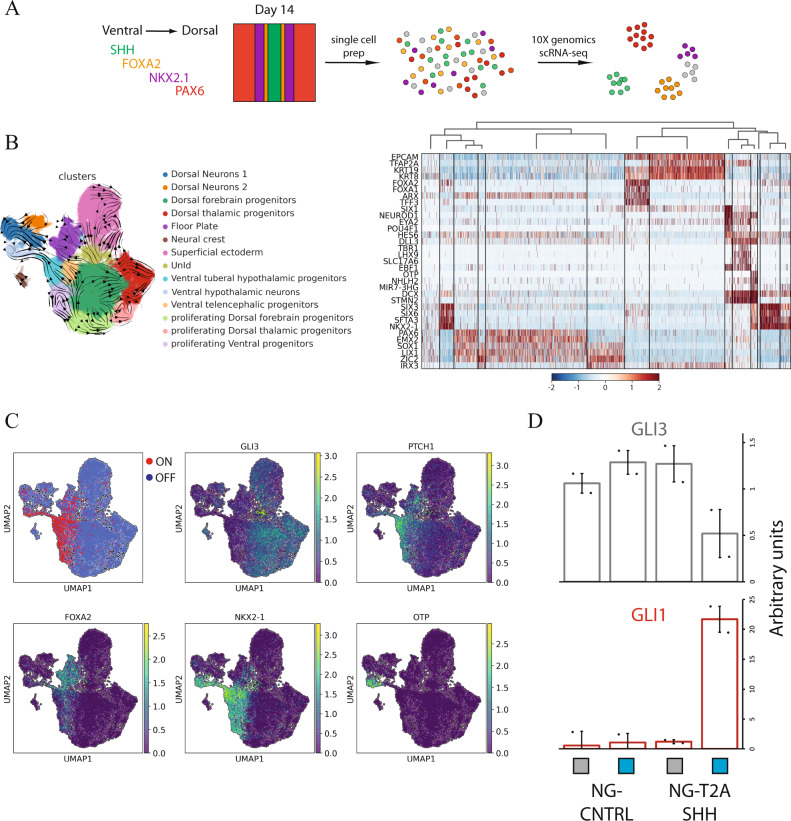
Fig. 3. scRNA-seq characterization of light-induced SHH neural cells.
A Schematization of the scRNA-seq profiling strategy. B Left panel: UMAP plot labeled with the identified cell identities and RNA velocity vectors: (i) FOXA2+/ARX Floor Plate, (ii) NKX2-1+/RAX+/SIX6+ Ventral tuberal hypothalamic progenitors, (iii) NKX2-1+/FOXG1+ Ventral telencephalic progenitors, (iv) NKX2-1+/NHLH2+/OTP+ Ventral hypothalamic neurons, (v) TFAP2A+/KRT19+ Superficial ectoderm, (vi) SOX10+/PLP1+ Neural Crest, (vii) PAX6+/EMX2+/OTX2+ Dorsal forebrain progenitors, (viii) IRX3+/OLIG3+ Dorsal thalamic progenitors, (ix) TBR1+/LHX1+ Dorsal Neurons_1, (x) HES6+/DLL3+ Dorsal Neurons_2, dorsal and ventral proliferating progenitors, (xi) Dorsal, (xii) Dorsal thalamic, (xiii) Ventral and (xiv) an UnIdentified population (UnId). Right panel: z-score scaled heatmap of marker genes used for cell identities classification. C UMAP plot displaying SHH responsive and unresponsive status, and GLI3 and PTCH1 expression level. SHH responsive and unresponsive status have been computed imposing a threshold based on the normalized distribution of GLI3, GAS1 and PTCH1 counts, where GLI3-GAS1low and PTCH1high represent SHH responsive while GLI3-GAS1high, PTCH1low unresponsive. D qRT-PCR analysis of SHH responsive genes (GLI1 and GLI3) for NG-T2A-SHH and NG-CNTRL at day 14 of differentiation. The histogram displays the average and SD of differentiated cells exposed to light stimulation or dark control (n = 2 biologically independent samples). .

