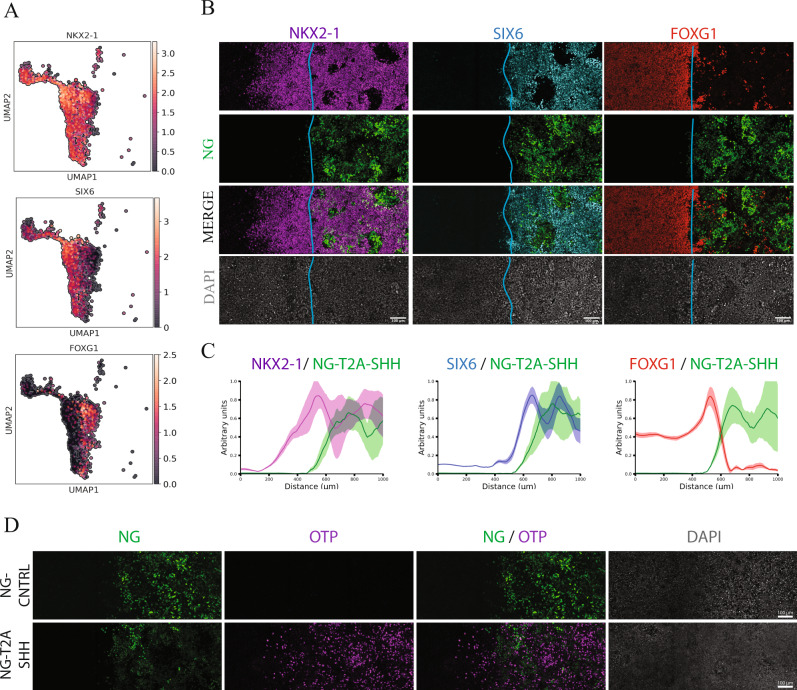
Fig. 4. Spatial self-organization of telencephalic and hypothalamic fates upon light-induced SHH.
A UMAP plot showing a selected population of cell NKX2-1+. Expression of markers that distinguish hypothalamic and telencephalic populations (NKX2-1, SIX6 and FOXG1). B Immunostaining shows the spatial segregation of ventral population arising from a light-induced SHH source at day 14. (Green NG, Magenta NKX2.1, Cyan SIX6, Red FOXG1, Gray DAPI), Scale bar = 100 μm. C Cumulative fluorescence intensity analysis (line profile) over the x-axis. x-axis displays the linear distance in μm. y-axis shows the cumulative fluorescent intensity profile in arbitrary units for each channel. Line profile shows the average (line) and SD (area) for each channel. The line profile is color-coded as the immunofluorescent channels, NG-Green, NKX2-1-Magenta, SIX6-Cyan, FOXG1-Red at day 14 quantification (n = 3 biologically independent samples). D Immunostaining shows OTP positive cells induced in proximity of the NG-T2A-SHH organizer but not in the NG-CNTRL. Light induced SHH drive the self-organization of both neural progenitors and neurons (Green NG, Magenta OTP, Gray DAPI), Scale bar = 100 μm.

