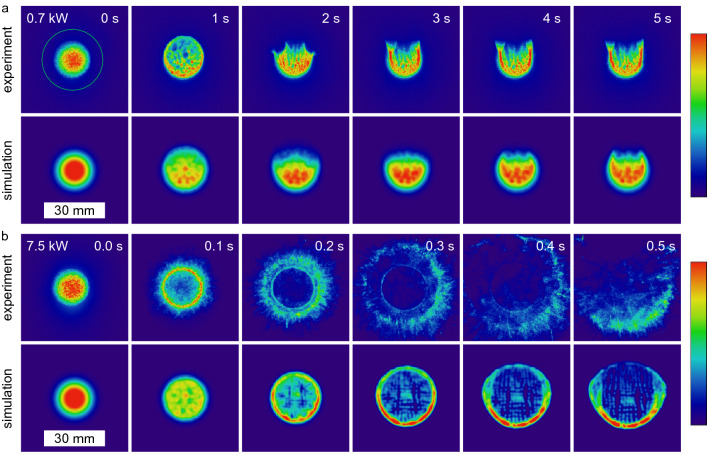
Figure 2.
Intensity distribution (colorbar on the right, logarithmic scale, arb. u.) of a laser spot (, input power 0.7 kW (a) and 7.5 kW (b), continuous wave) after passing 10.1 cm water determined by experiments and simulations. For the lower input power, first a size increase and then an opening towards the top is observed. The green circle indicates the aperture size of the used power meter. For the high input power, a much faster change over a ring pattern to a fast changing and irregular large pattern is observed. Phenomenologically, there is a good agreement between the experimental and simulated results, considering that in the simulation the change of the refractive index was not taken into account for the energy deposition (see text for explanation).

