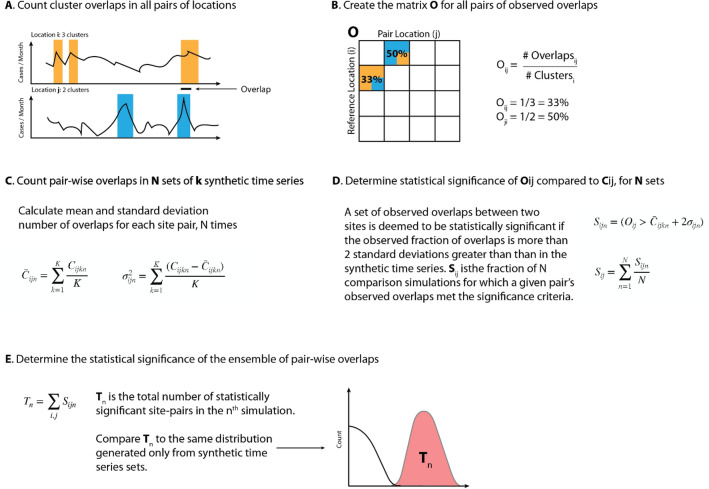
Figure 1.
Schematic of methods used in the overlap analyses (shown here for clusters). (A) Clusters (periods of locally-defined high KD incidence) were defined and denoted for each site’s time series of KD onsets. Overlaps were defined between sites as contemporaneous existence of clusters in two sites, plus or minus 6 days. (B) We defined the matrix of pair-wise cluster overlaps, for all site-pairs. (C) We created 500 synthetic comparison time series for each site (shuffling cluster dates), and assessed mean and variance of cluster overlaps within pairs of sites. (D) We then determined statistical significance of observed site pair cluster overlaps by comparing the observed record to the mean and variance of the synthetic time series overlaps. Overlaps occurring more than 2 standard deviations from the mean of the synthetic series were considered statistically significant. We repeated (C+D) 500 times, and then assessed the total fraction (Sij) of times within these simulations that a site-pairs observed overlaps were deemed statistically significant. (E) We then tallied the total number of statistically-significant site-pairs within each simulation to assess the ensemble of overlaps. We compared this distribution to a synthetic comparison distribution in which members of our synthetic time series were compared with each other. (i.e. for step (D), comparing overlaps within the synthetic time series to the mean and standard deviation, as opposed to comparing the observed record). We conducted a similar process for quiet period overlaps, except that we counted the fraction of overlapping days in each quiet period. Figure 6A,B show the matrices Oij in text and Sij in color, and Fig. 6C,D show Tn.

