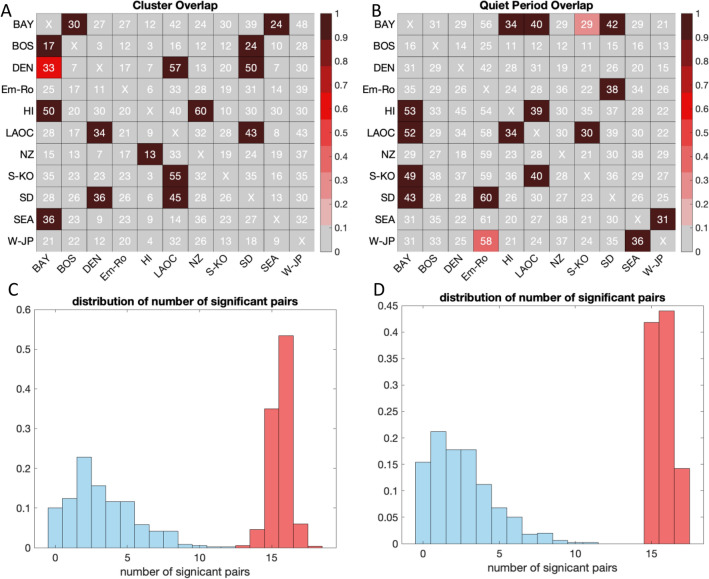
Figure 6.
Statistics of cluster and quiet period overlaps across pairs of sites. (A,B) Number in each cell is the observed overlap (Oij) between KD clusters (A) and quiet periods (B) across all pairs of sites. Cell color shows the fraction of times (over 500 simulations) that a pair of sites had observed overlaps that were statistically different (> 2SD) from the simulated time series overlaps (Sij). (C,D) Blue distribution shows the total number of pairs of sites with statistically significant overlaps when each member of the synthetic time series is compared to the other 499; red distribution shows the total number of statistically significant site pairs when the observed record was compared to the 500 synthetic time series (i.e., the number of pairs of sites with overlaps > 2 standard deviations above the comparison, or Tn).

