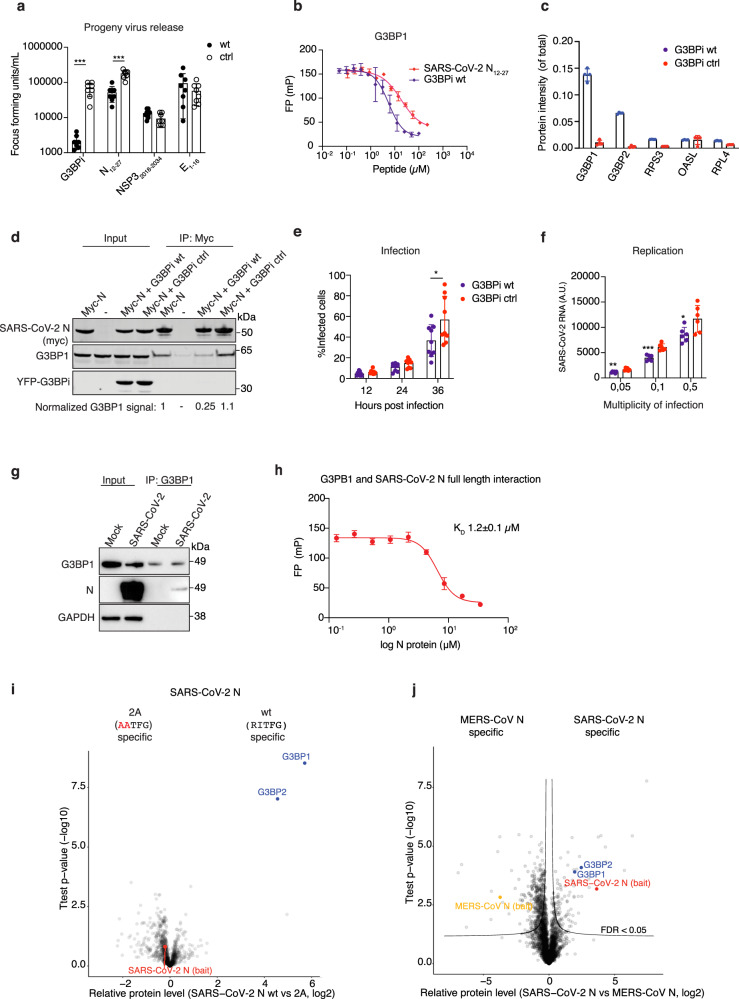
Fig. 2. The interaction between N and G3BP1/2 is important for SARS-CoV-2 infection.
a Screen for SARS-CoV-2 antiviral activity of viral peptides including the G3BP inhibitor G3BPi (p = 0.000013) and N12-27 (p = 0.000005). The amount of SARS-CoV-2 virus released was determined 16 h postinfection by focus forming assay (n = 8 independent experiments). b Affinity measurements of recombinant G3BP1 NTF2 binding to G3BPi and the SARS-CoV-2 N peptide (n = two biological duplicates each containing three technical replicates). Shown is a representative plot from one of the experiments. c Quantitative mass spectrometry comparison of G3BPi wt and ctrl purified from HeLa cells (n = 4 technical replicates). d Purification of myc-tagged SARS-CoV-2 N expressed in HeLa cells and its interaction with G3BP1 analyzed by western blot. G3BPi wt or ctrl were co-expressed with myc-tagged N where indicated. Shown is a representative blot from three independent experiments. e Effect of G3BPi on % infected VeroE6 cells during 36 h of infection (n = 9 independent experiments) *P = 0.0414. f Amount of SARS-CoV-2 RNA measured 16 h postinfection with qPCR at different MOI in VeroE6 cells expressing G3BPi or control inhibitor (n = 6 independent experiments) *P = 0.0291, **P = 0.0029, ***P = 0.0002. g Endogenous G3BP1 was purified from mock or SARS-CoV-2 infected cells and probed for N. Shown is a representative blot from three independent experiments. h In vitro interaction of recombinant full-length SARS-CoV-2 N and the NTF2 domain of G3BP1 as measured by fluorescence polarization spectroscopy (n = two biological duplicates each containing three technical replicates). Shown is a representative plot. i Quantitative mass spectrometry analysis of YFP-tagged SARS-CoV-2 N wt or 2 A purified from HeLa cells (n = 4 technical replicates). j Quantitative mass spectrometry analysis of YFP-tagged N SARS-CoV-2 and N MERS purified from HeLa cells (n = 4 technical replicates). Asterisks indicate statistical significance calculated by two-sided unpaired T test (panel a, e, f). Mean ± SD indicated throughout in the graphs. Source data are provided as a Source Data file.

