FIGURE 3.

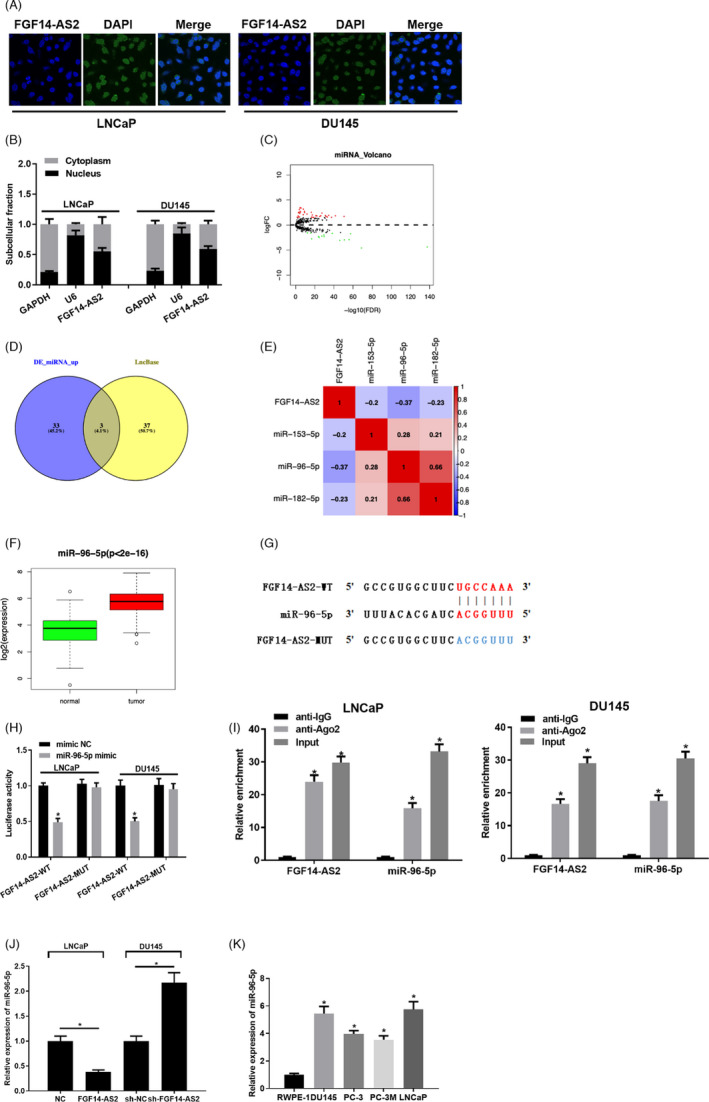
FGF14‐AS2 directly inhibits miR‐96‐5p expression. (A) Results of FISH assay of LNCaP and DU145 cells. (B) qRT‐PCR detected FGF14‐AS2, U6, and GAPDH expression level in cell nucleus and cytoplasm in LNCaP and DU145 cells after separation of nucleus and cytoplasm. (C) 51 differentially expressed miRNAs obtained from TCGA database (red: upregulated expression; green: downregulated expression). (D) Venn diagram of differentially expressed miRNAs and predicted miRNAs. (E) Association between miRNA candidates and FGF14‐AS2. (F) Boxplot of miR‐96‐5p levels. (G) Binding sites between FGF14‐AS2 and miR‐96‐5p. (H‐I) The binding relationship between miR‐96‐5p and FGF14‐AS2. (J) qRT‐PCR detected the effect of FGF14‐AS2 expression level on miR‐96‐5p expression in NC, FGF14‐AS2, sh‐NC, and sh‐FGF14‐AS2 groups. (K) Level of miR‐96‐5p. *Denotes p < 0.05
