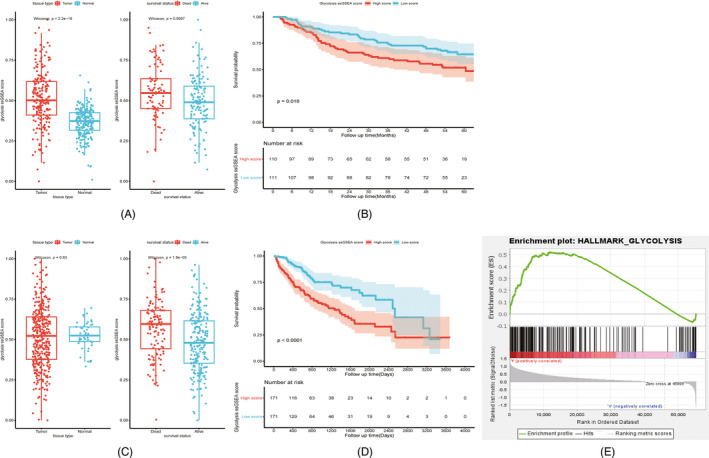
FIGURE 1.

ssGSEA analysis of glycolysis pathway (HALLMARK_GLYCOLYSIS) in HCC. Comparison of glycolysis ssGSEA scores among different subgroups in GEO14520 (A). Influence of glycolysis ssGSEA score level on survival prognosis in GEO14520 (B). Comparison of glycolysis ssGSEA scores among different subgroups in TCGA‐LIHC (C). Influence of glycolysis ssGSEA score level on survival prognosis in TCGA‐LIHC (D). Gene set enrichment plots of HALLMARK_GLYCOLYSIS in TCGA‐LIHC (E)
