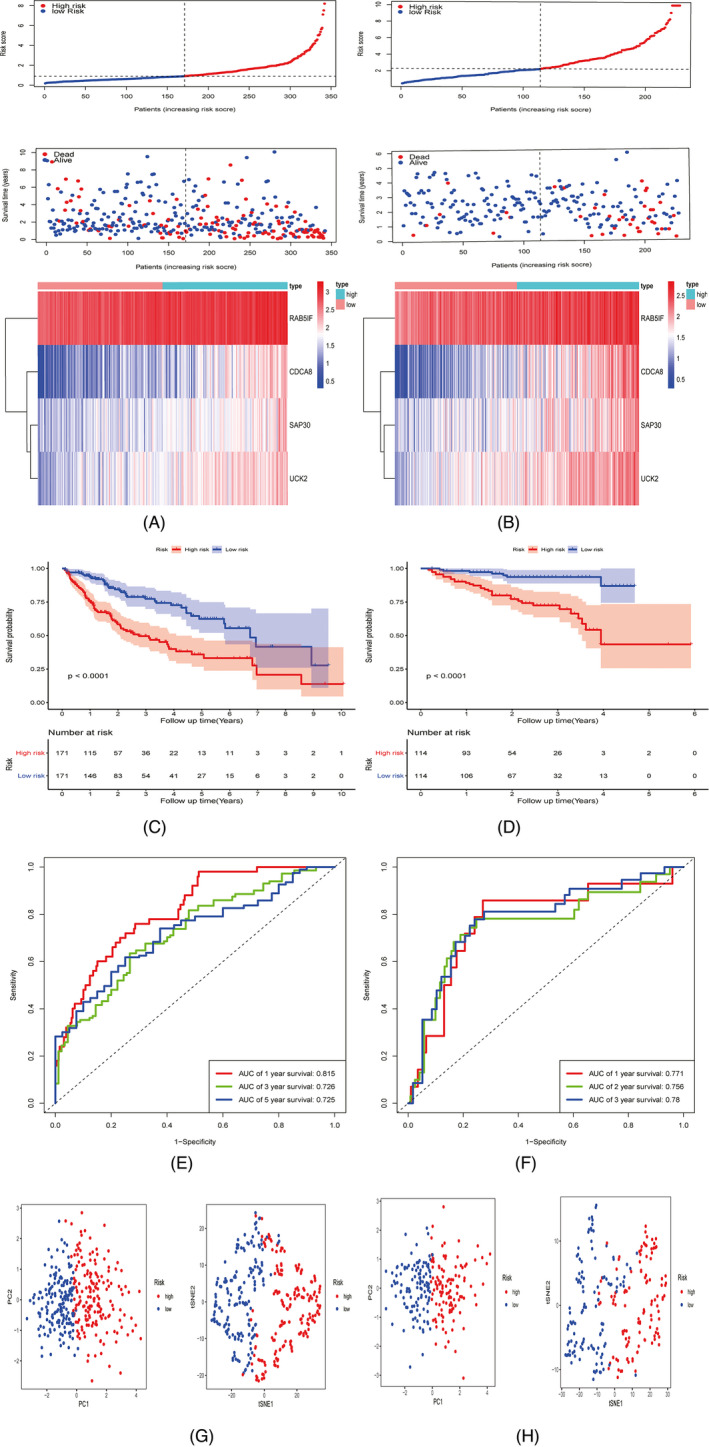
FIGURE 4.

Development and validation of prognostic signature based on four genes (CDCA8, RAB5IF, SAP30, and UCK2) in TCGA‐LIHC and ICGC‐LIRI‐JP cohorts. The risk and survival distribution of the patients, and the heatmap of the four genes in TCGA‐LIHC and ICGC‐LIRI‐JP cohorts (A‐B). KM curve revealing the significantly shorter OS in the high‐risk group compared with the low‐risk group in TCGA‐LIHC and ICGC‐LIRI‐JP cohorts (C‐D). ROC curve of the risk signature in TCGA‐LIHC and ICGC‐LIRI‐JP cohorts (E‐F). PCA and t‐SNE analyses of low‐ and high‐risk groups in TCGA‐LIHC and ICGC‐LIRI‐JP cohorts (G‐H)
