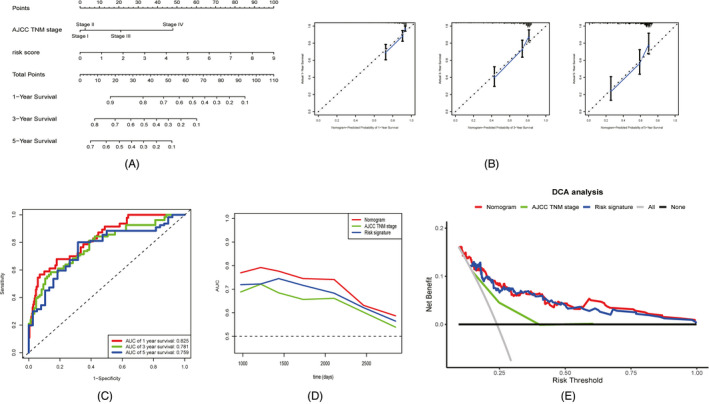
FIGURE 8.

Development of the nomogram consisted of AJCC TNM stage and four‐gene based prognostic signature. Nomogram plot (A). Calibration plots of the nomogram to predict 1‐, 3‐, and 5‐year OS (B). ROC curves of the nomogram to predict 1‐, 3‐, and 5‐year OS (C). Time‐dependent AUC curves of the nomogram and its components (d). DCA analysis of the nomogram and its components (E)
