FIGURE 3.

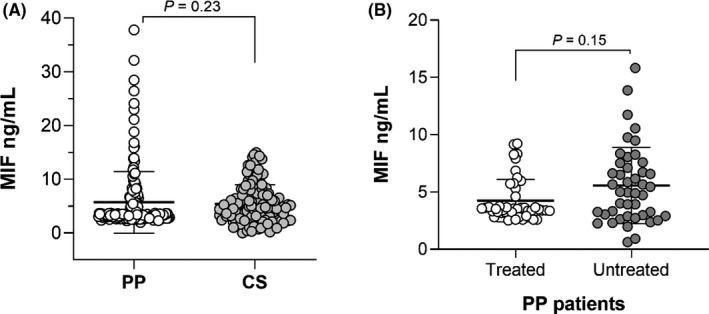
Comparison of MIF serum levels. (A) MIF serum levels of PP patients and CS. (B) Comparison of MIF serum levels by treatment in PP patients. p‐Value was calculated using U‐Mann–Whitney; the data are provided in medians and p25th–p75th

Comparison of MIF serum levels. (A) MIF serum levels of PP patients and CS. (B) Comparison of MIF serum levels by treatment in PP patients. p‐Value was calculated using U‐Mann–Whitney; the data are provided in medians and p25th–p75th