
FIGURE 1.
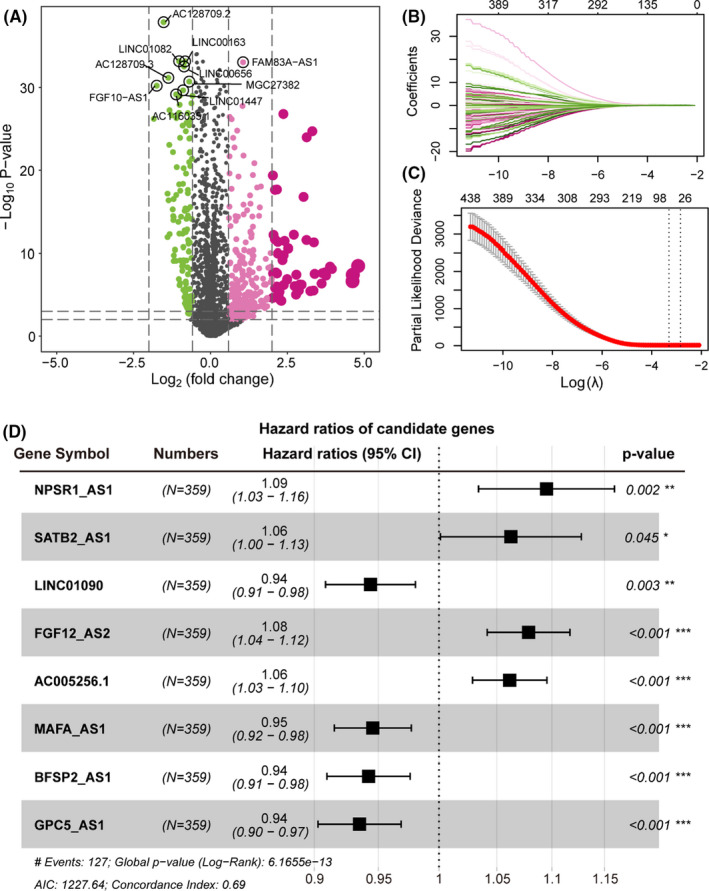
The PR‐lncRNAs contributes to patient survival outcomes in LUAD. (A) Volcano plot showing the differentially expressed lncRNAs in LUAD. x‐axis represents the log2(Fold Change). Y‐axis shows the log10(p‐value). (B‐C) Lasso regression model screened characteristic lncRNA. Variation curve of regression coefficient and β value. (D) Forest plot of multivariate Cox regression results, which include p‐value and confidence interval of hazard ratios