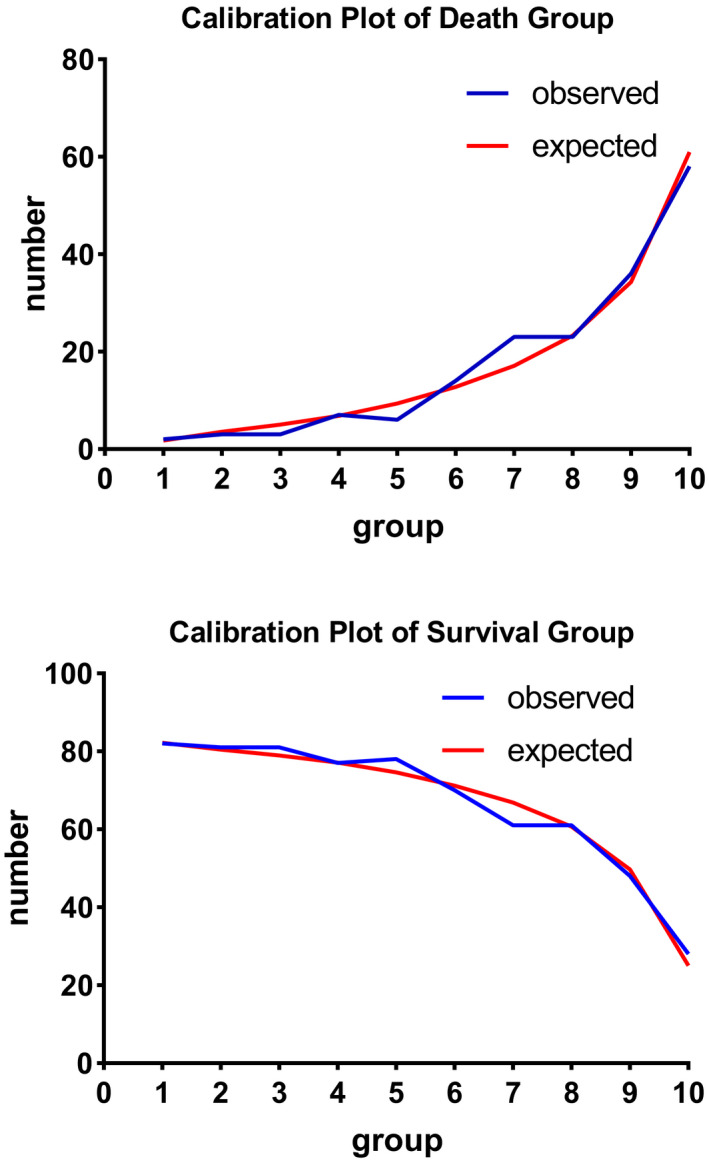
FIGURE 2.

Calibration Plot of Death Group and Survival Group show the relationship between the observed outcome frequencies and the predicted frequencies; model is adjusted by age, BMI, red blood cell distribution width, hematocrit, lactate, blood urea nitrogen, admission type, acute renal failure, and sepsis
