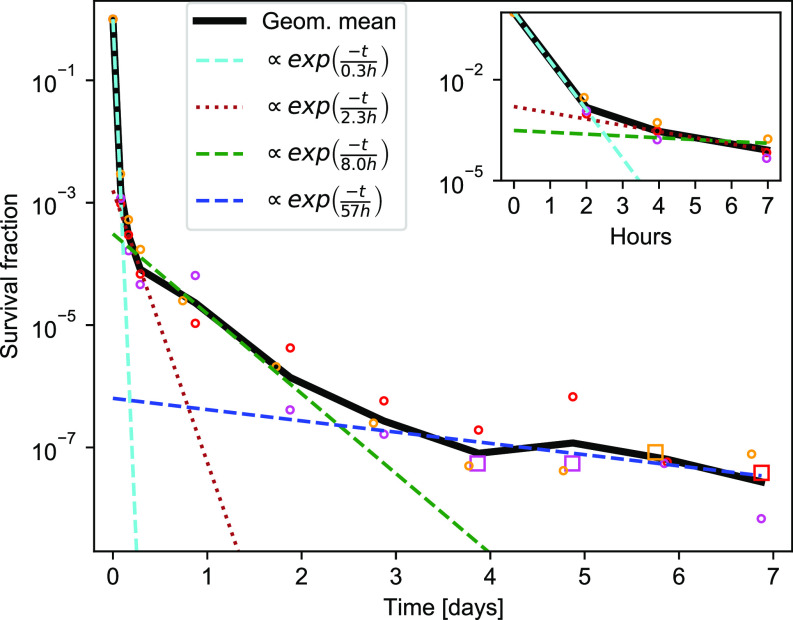
Figure 1. Killing dynamics of exponential-phase Escherichia coli persisters.
Killing dynamics for exponential-phase persisters. The bacteria were grown in glucose minimal medium. All three biological replicates are shown for each data point (circle). When zero colonies are recovered, the detection limit is shown (square, see the Materials and Methods section for details). The black line is the geometrical mean. Each separate phase of a triphasic fit is shown, respectively, as cyan, green, and blue dashed lines. The second phase of a biphasic fit to the first 7 h is shown as a brown dotted line.

