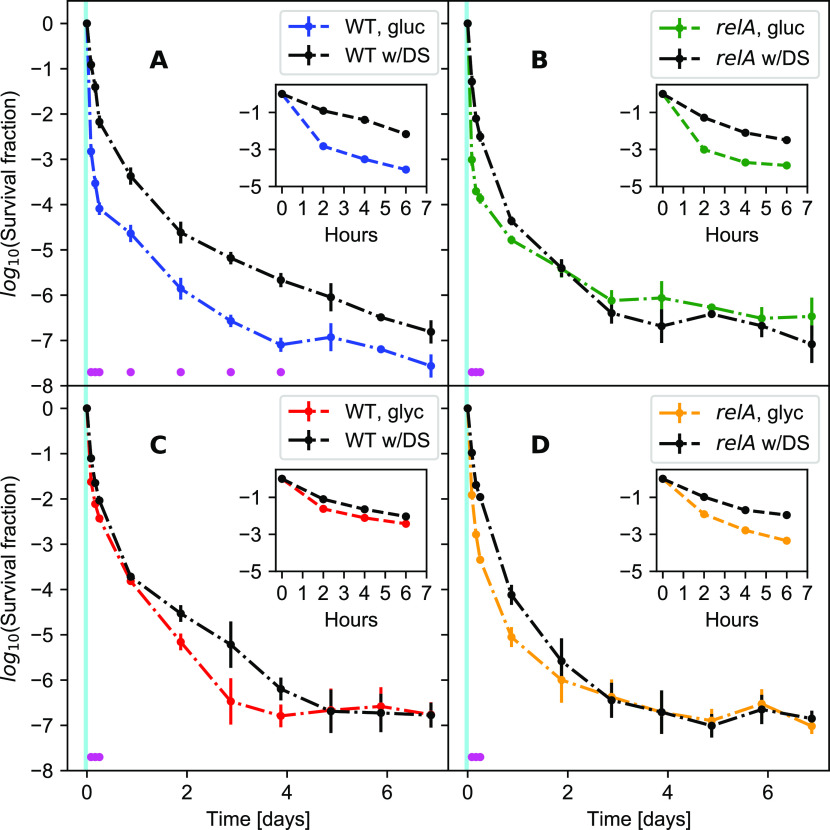
Figure 4. The effect of a short starvation-pulse on the survival dynamics.
All strains and conditions are shown with and without the downshift. The black line is with the downshift, the colored line is without the downshift. The magenta dots represent statistically different data points as tested by an unequal variances two-sided t test. The cyan interval illustrates the downshift period before the killing assay. (A) The wild type in glucose. A downshift in glucose significantly enhances wild-type survival for 4 d and seems to be increased for up to all 7 d. (B) The ΔrelA mutant in glucose. (C) The wild type in glycerol. (D) The ΔrelA mutant in glycerol.

