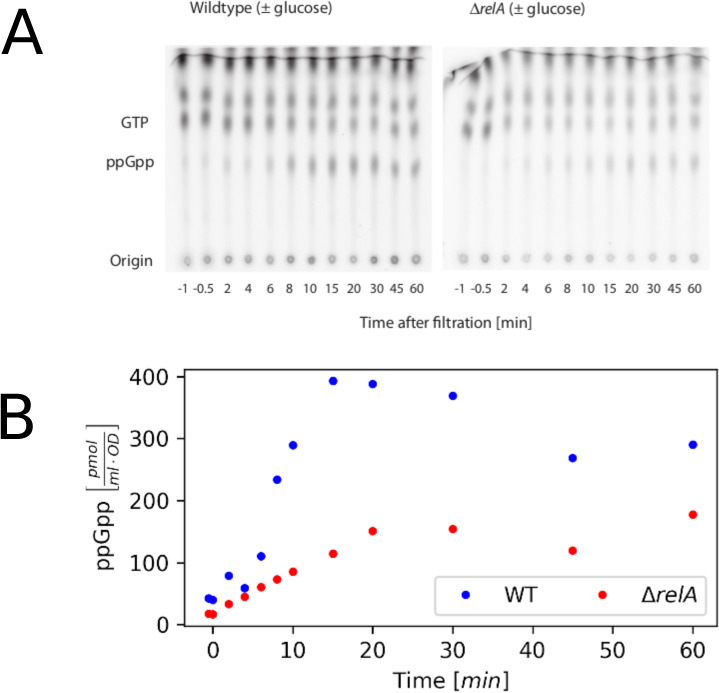
Figure S4. The measurements of ppGpp during a glucose downshift.

(A) PhosphoImager scan of TLC plates used to separate nucleotide pools in samples from strains in glucose downshifts. The radioactivity in the individual ppGpp spots was quantified to estimate the ppGpp content of the cultures. (B) Quantified ppGpp level plotted as function of time from downshift. The result yielded dynamics comparable with those obtained by Lazzarini et al (29). The intracellular level of ppGpp reached a higher peak in our wild-type strain than in our ΔrelA strain during a 1-h glucose downshift.
