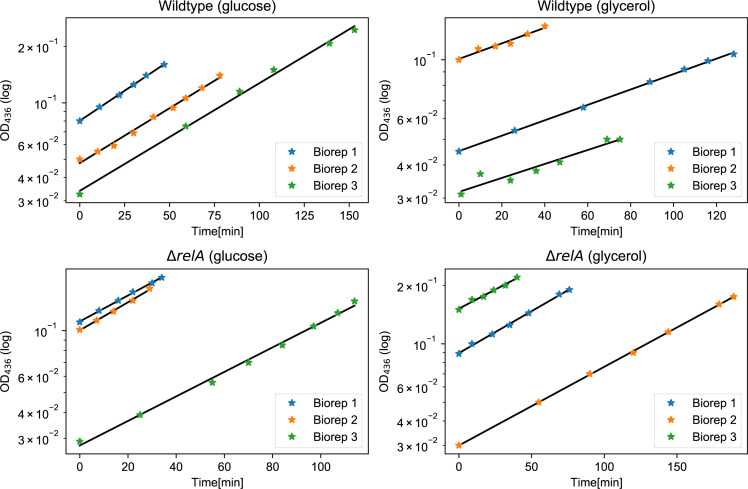
Figure S5. Confirmation of exponential growth before the downshift.
Each growth curve represents a biological replicate. Two samples from each of these cultures were filtered separately and placed into two separate flasks, one experiencing the downshift and one without downshift, as shown in Fig 3 in the main text. The growth rate is obtained by an exponential fit to these growth curves and the results are shown in Table S1. The OD436 is the optical density of the culture measured at the wavelength of 436 nm, which reflects bacterial growth.

