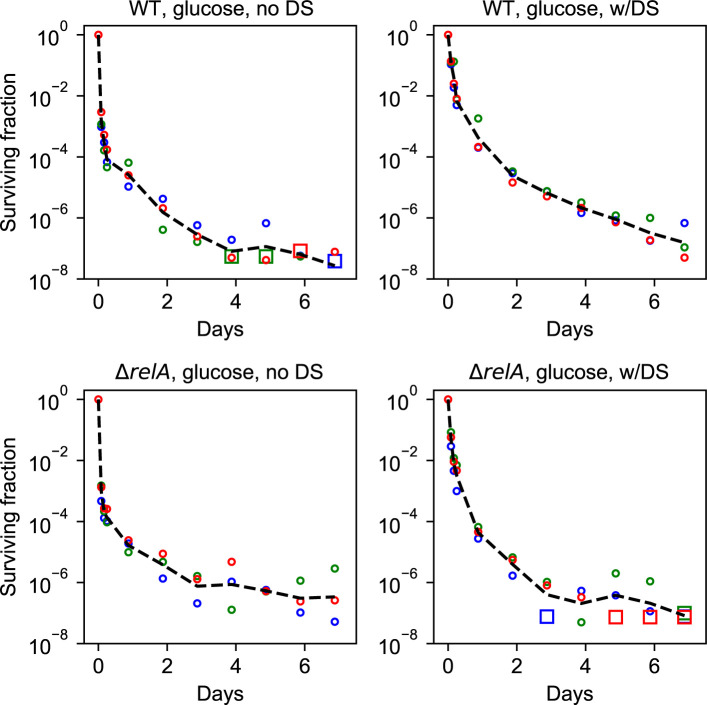
Figure S7. Each replicate shown for all experiments in glucose.
The black line represents the geometric mean. Each data point represents a biological replicate. The circles are data points with a nonzero CFU count. The squares represent a CFU count of zero, where the zero is replaced by the detection limit. Data from experiments with a sugar downshift are labeled “w/DS,” whereas “no DS” refers to experiments without a downshift.

