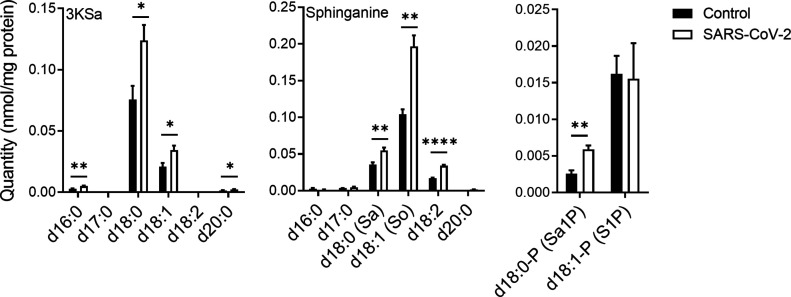
Figure 1. SARS-CoV-2 infection induces elevation of sphingoid base levels in vitro.
Vero E6 cells were infected with SARS-CoV-2 at a MOI of 5, and SL levels were quantified at 3 hpi by LC–MS. 3KSa, 3-ketosphinganine; Sa, sphinganine; Sa1P, sphinganine-1-phosphate; S1P, sphingosine-1-phosphate. Data are the means of four biological replicates ± SEMs. Statistical analysis was performed using a two-tailed unpaired t test. P-values are indicated by asterisks, as follows: *P < 0.05, **P < 0.01, and ****P < 0.0001. Differences with a P-value of 0.05 or less were considered significant. Graphs were generated using GraphPad Prism software version 8.4.3. Complete dataset in Table S1.

