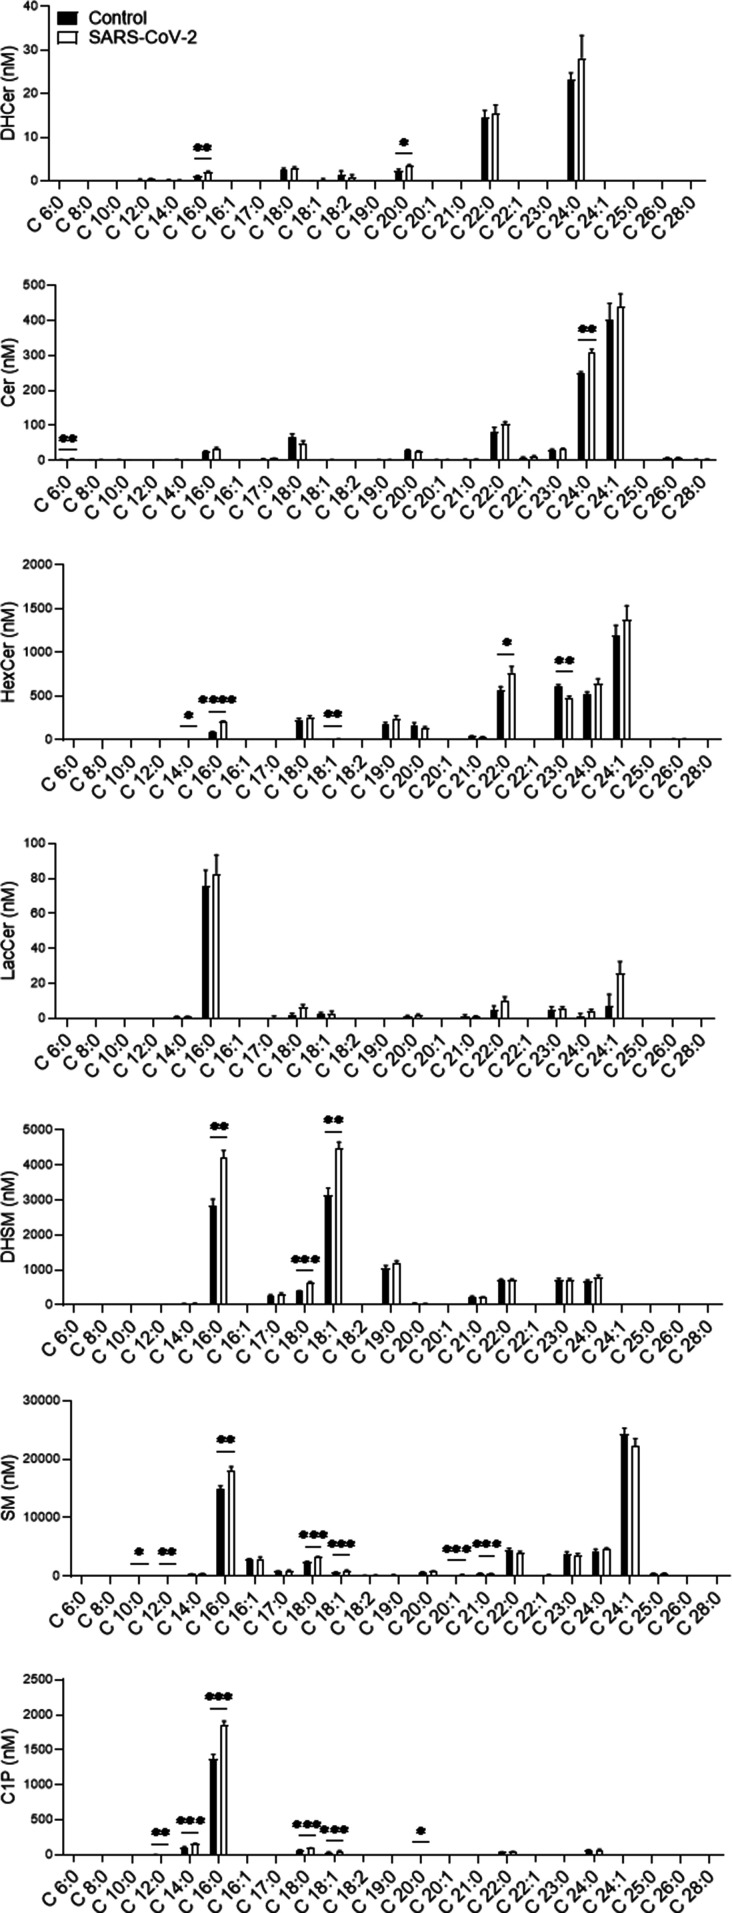
Figure 6. SARS-CoV-2 infection induces elevation in sphingolipid levels in murine serum.
K18-hACE2 transgenic mice were infected with SARS-CoV-2 (20 pfu, intranasally inoculated, n = 5) or uninfected (control, n = 4). Sphingolipid levels in serum samples obtained at day 5 post infection were analyzed by LC–MS. DHCer, dihydroceramide; Cer, ceramide; HexCer, hexosylceramide; LacCer, lactosylceramide; DHSM, dihydrosphingomyelin; SM, sphingomyelin; C1P, ceramide-1-phosphate. Data are means± SEMs. Statistical analysis was performed using a two-tailed unpaired t test. P-values are indicated by asterisks, as follows: *P < 0.05, **P < 0.01, ***P < 0.001, and ****P < 0.0001. Differences with a P-value of 0.05 or less were considered significant. Graphs were generated using GraphPad Prism software version 8.4.3. Complete dataset in Table S3.

