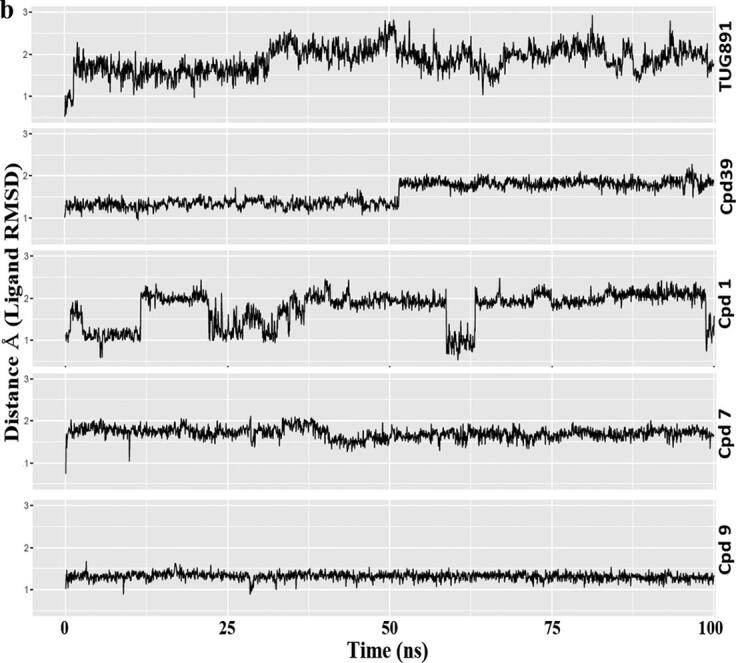
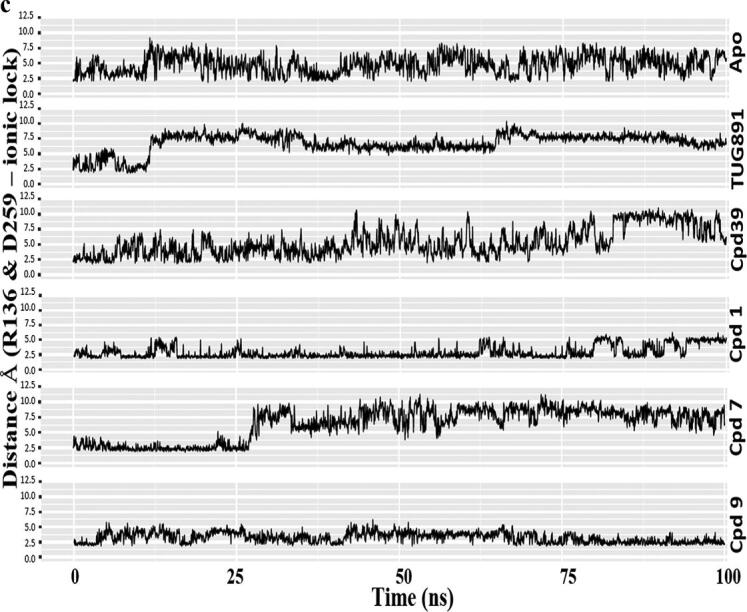
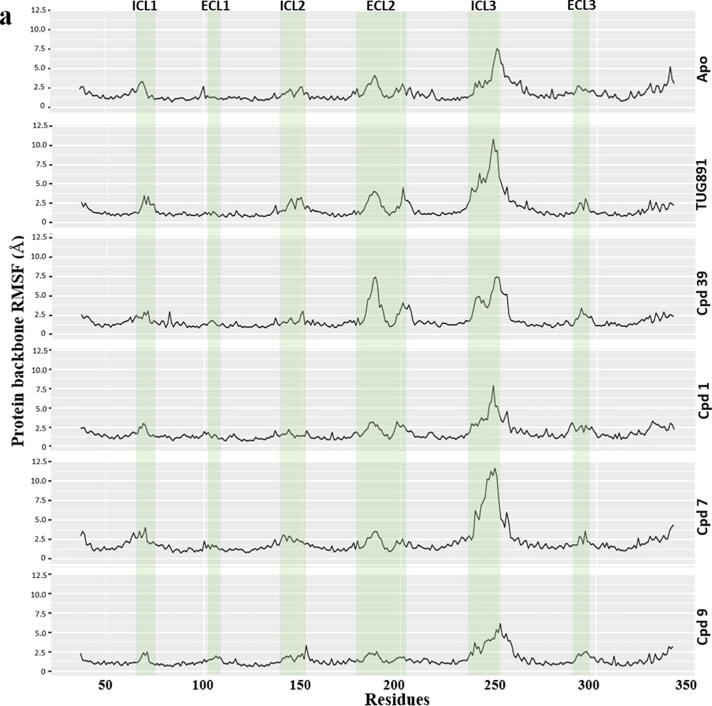
Fig. 7.


Comparative MD simulation analysis of best hits, compound 1, 7 and 9 with respect to Apo, TUG-891 and Compound39 bound proteins over 100 ns timescale; a) RMSF plot of the protein backbone. The intracellular loop (ICL) and extracellular loop (ECL) regions are highlighted as shaded regions. The transmembrane regions in the 3D structure are - TM1: 36–65; TM2: 73–101; TM3: 107–141; TM4: 152–175; TM5: 204–233; TM6: 252–289; TM7: 296–324; b) RMSD plot of the ligand atoms; c) Distance plot between the center of mass of residues R136(TM3) and D259(TM6) involved in “ionic-lock” conformation.

