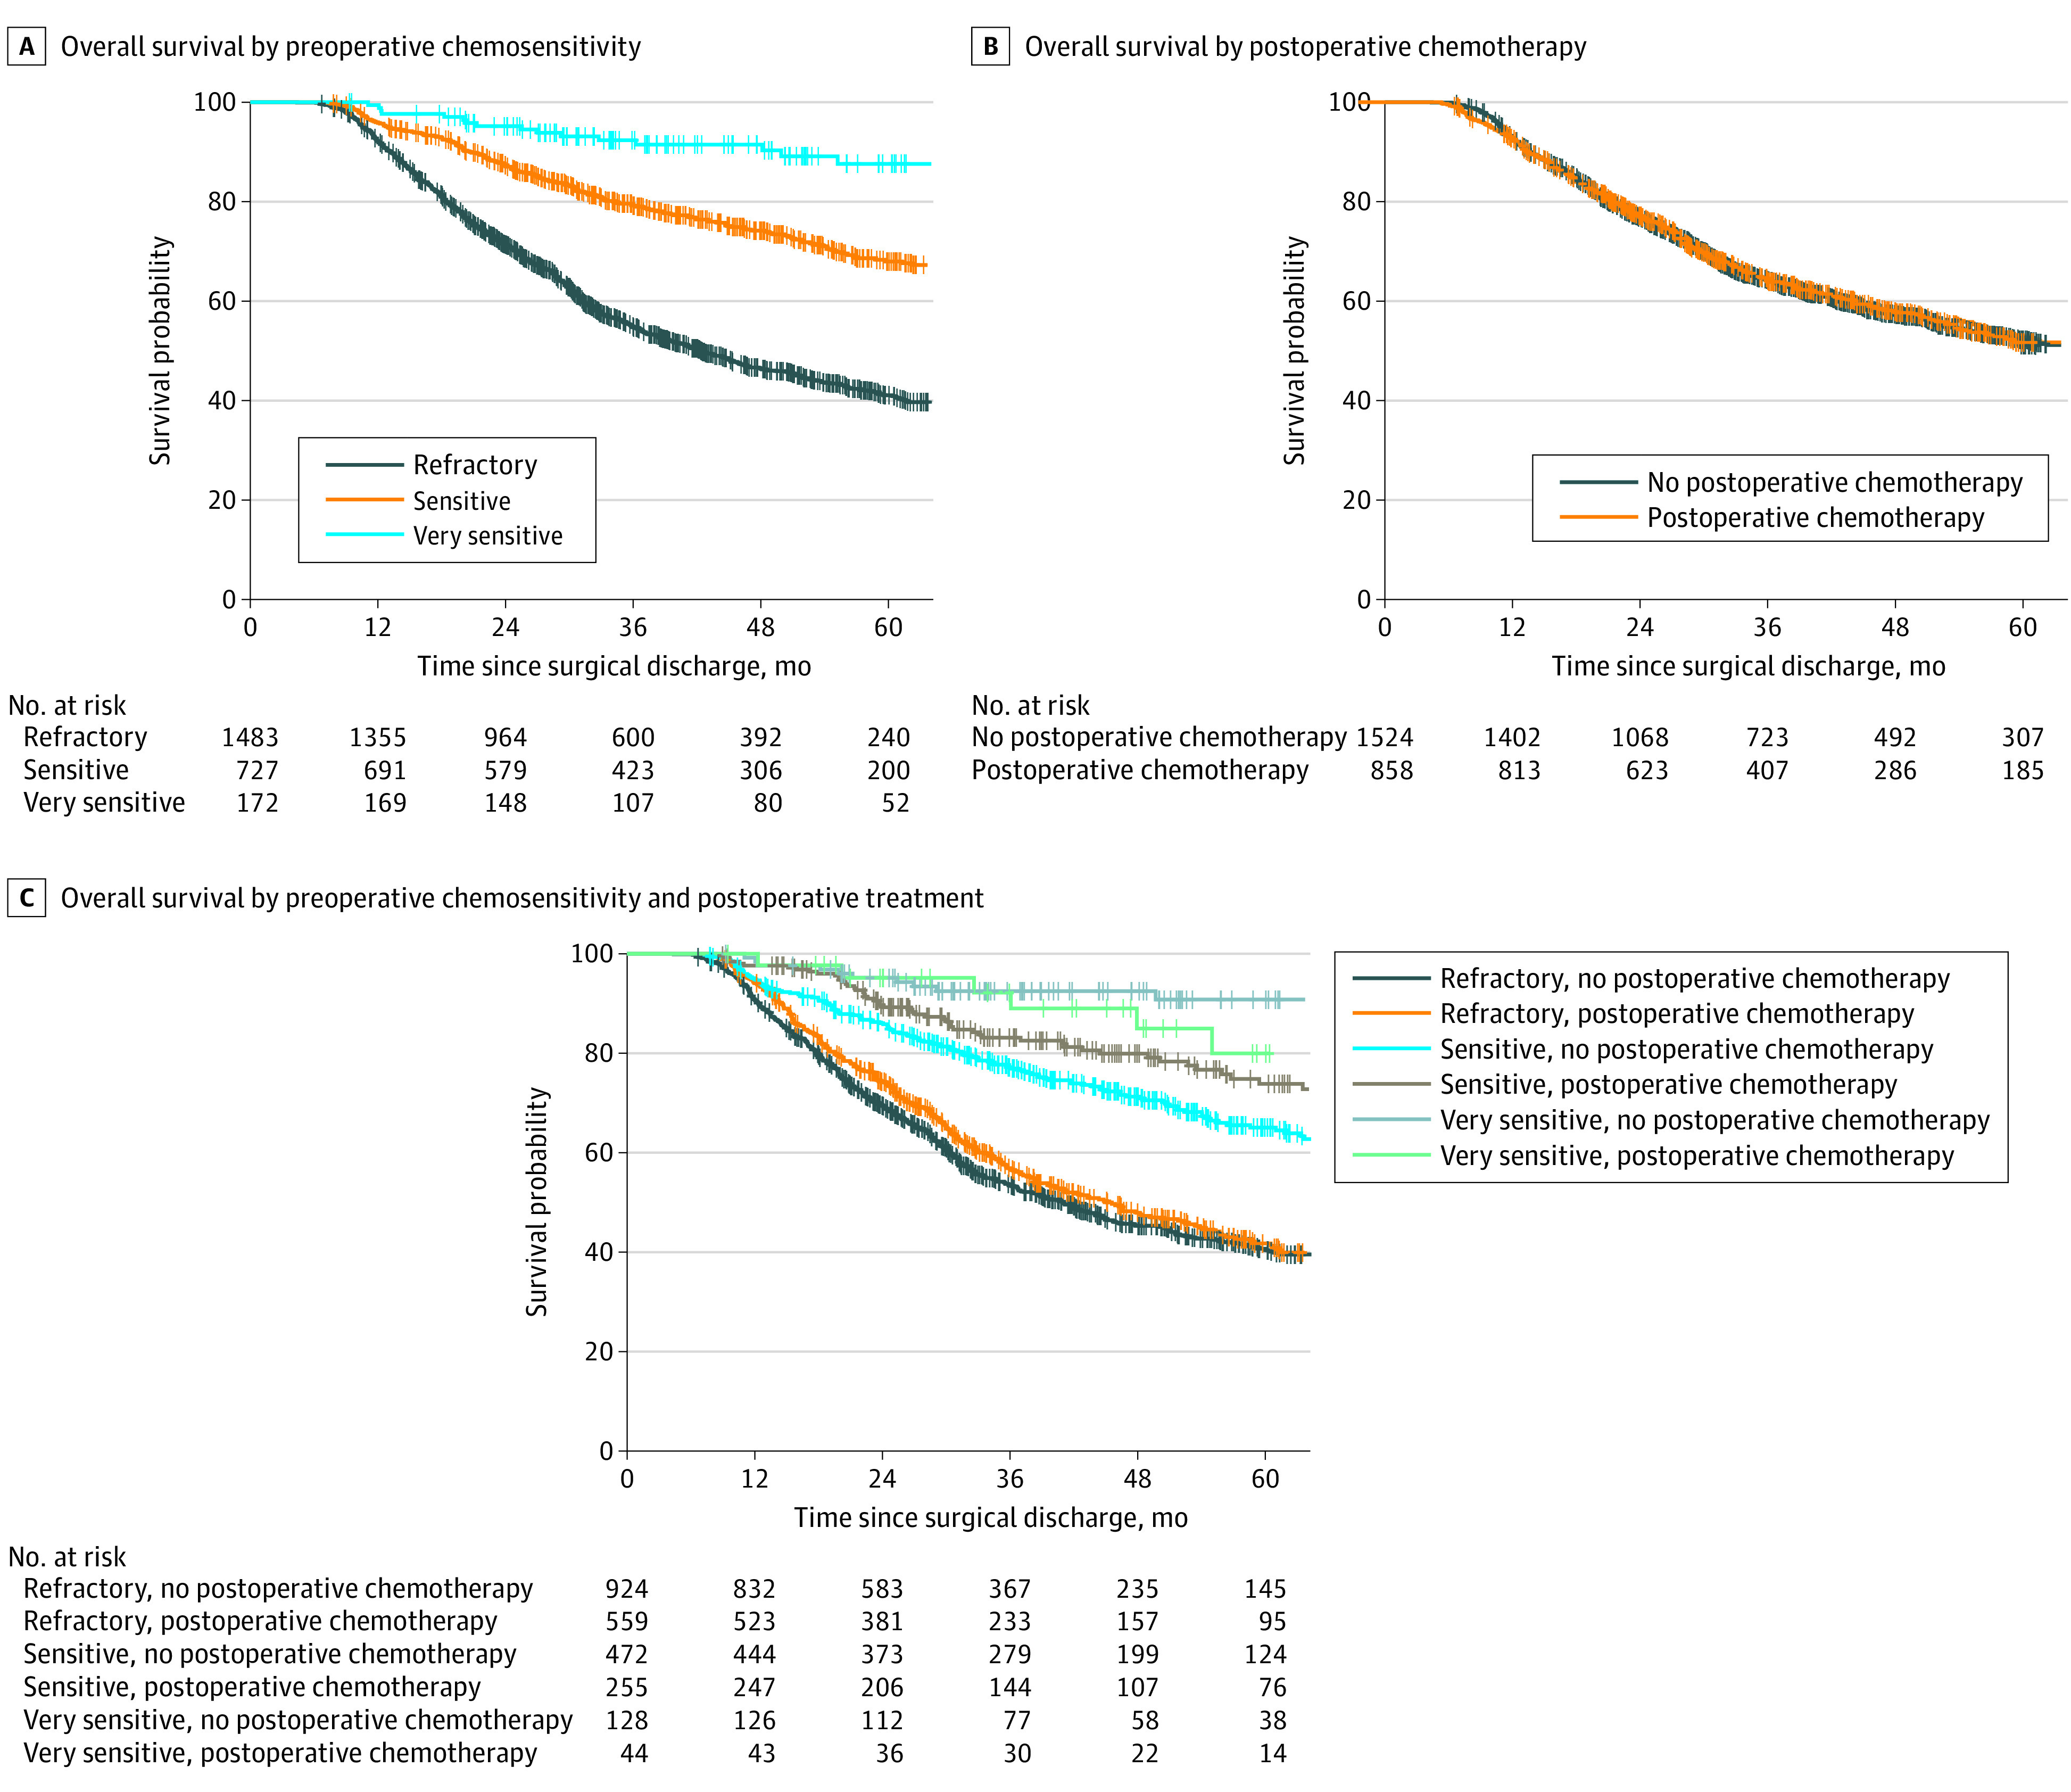
Figure. Kaplan-Meier Curves for Overall Survival in Patients With Resected Clinical Stage II to III Gastric Adenocarcinoma Who Received Preoperative Chemotherapy and Surgery.

Graphs show patients stratified by preoperative chemosensitivity (A), postoperative treatment (B), and preoperative chemosensitivity and postoperative treatment (C).
