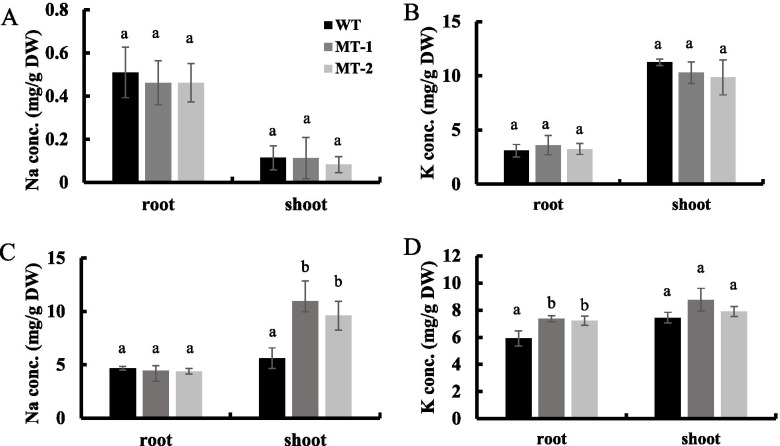
Fig. 5.
Tissue Na+ and K+ concentration in WT and OsNAC3 knockout lines under normal condition or 75 mM NaCl treatment for 10 days. (A) Na+ concentration in the roots and shoots under normal conditions. (B) K+ concentration in the roots and shoots under normal conditions. (C) Na+ concentration in the roots and shoots under 75 mM NaCl treatment. (D) K+ concentration in the roots and shoots under 75 mM NaCl treatment. 14-day-old transgenic and Nipponbare rice were treated with 0 or 75 mM NaCl for 10 days. Data represent means ± SD (n = 3). Different letters indicate significant differences (Tukey test, p < 0.05)

