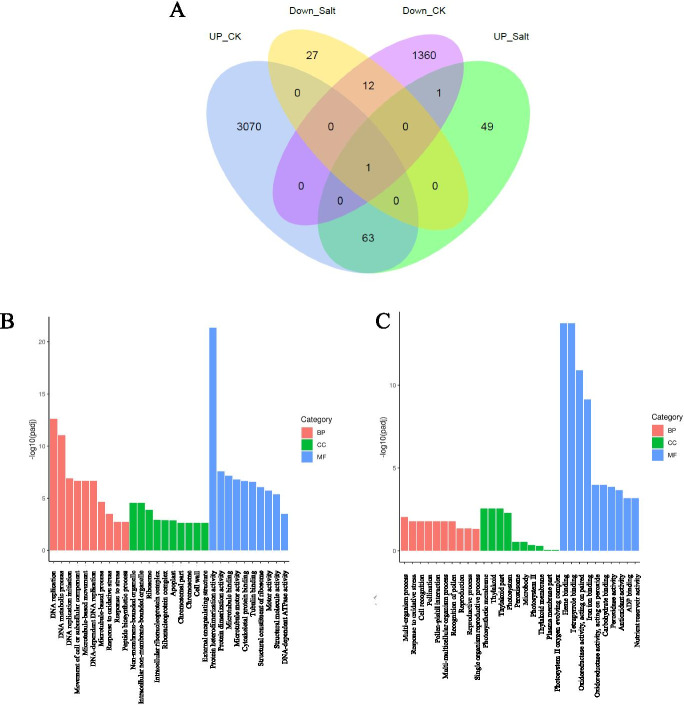
Fig. 6.
Transcriptome analysis of OsNAC3-regulated genes. (A) Venn diagram showing the OsNAC3 regulated genes in MT and WT lines. UP_CK: upregulated genes in MT compared with WT under normal conditions (fold-change > 2). UP_SALT: upregulated genes in MT compared with WT under high salinity (fold-change > 2). DOWN_SALT: the downregulated genes in MT compared with WT under high salinity (fold-change < 0.5). DOWN_CK: the downregulated genes in MT compared with WT under normal conditions (fold-change < 0.5) (B, C) GO analysis of downregulated (left) and upregulated (right) genes in MT compared with WT. BP: biological process. CC: cellular component. MF: molecular function. Three biological replicates (n = 3) were performed for each treatment

