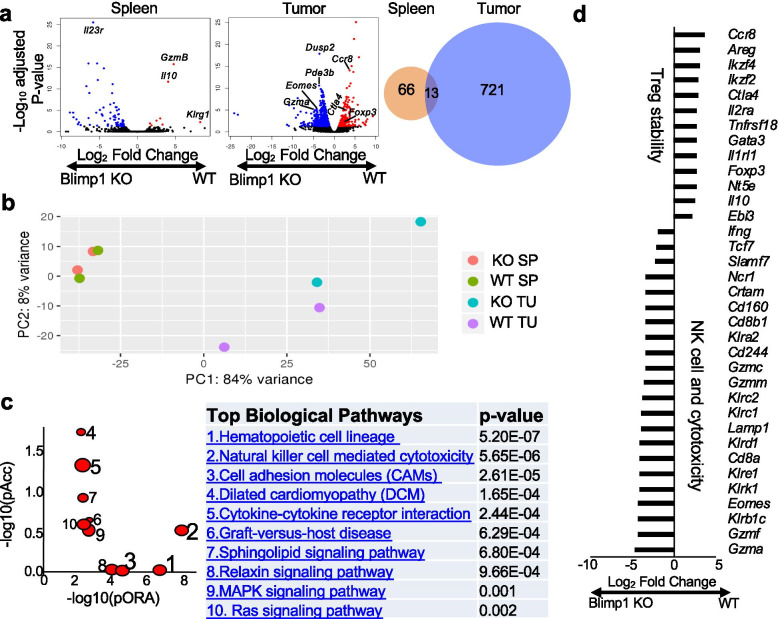
Fig. 6.
TIL eTreg cells from Prdm1fl/flFoxp3YFP-Cre mice display distinct transcriptomic profiles. WT or Prdm1fl/flFoxp3YFP-Cre (KO) mice were implanted with B16-OVA and immunized with NP-OVA (as in Fig. 2c). Splenic and tumoral eTreg cells (CD45+CD44+YFP+CD4+CD3+) were sorted for gene expression profiling (duplicates). a) DEGs in splenic and TIL WT and Blimp1 KO eTreg cells were analyzed by volcano plots and venn diagram. In the plots, each data point represents a gene. The x-axis and y-axis represent the log2 fold change of each gene and the -log10 of its adjusted p-value, respectively. Red dot: the upregulated genes in WT eTreg cells with an adjusted p-value < 0.05 and a log2 fold change > 1. Blue dots: the downregulated genes in WT eTreg cells with an adjusted p-value < 0.05 and a log2 fold change < − 1. Some genes involved in the regulation of Treg cells are denoted. b) Principal component analysis of all 4 subsets. SP: spleen; TU: tumor. c) Pathway enrichment of TIL WT and KO eTreg cells is presented by scatter plot and top biological pathways. pORA: probability of over-representation; pAcc: probability of accumulation. Right, P values are listed in the accompanying table. d) List of DEGs (at a > 2 log2-fold change and P < 0.05) of TIL WT and KO eTreg cells related to Treg stability or NK cell and cytotoxicity

